
The Ripple Effects of the US/China Trade Embargo
April 29, 2025 By Sage Advisory
In an interview last week, Treasury Secretary Scott Bessent characterized the trade situation with China as “unsustainable,” pointing to possible relief through negotiations with Chinese officials. The current level of tariffs of 145% on Chinese goods and 125% on US goods going into China amounts to a trade embargo between the two countries. We are starting to see signs of weakness in US/China trade via shipping data that could eventually flow through to the US consumer if this trade embargo were to continue over the coming months.
The port of Los Angeles, which accounts for 17% of all US imports and is a key destination for Chinese goods, has not seen volumes diminish recently; however, data from IMF PortWatch shows that there was a period of huge volume in the first quarter prior to the inauguration, which could illustrate shippers’ desire to front-load imports ahead of Trump taking office. A report in the Financial Times says that port officials are expecting shipping volumes to slow: “scheduled arrivals in the week starting May 4 [are expected] to be a third lower than a year before. . . . Bookings for standard 20-foot shipping containers from China to the US were 45 percent lower than a year earlier by mid-April.”
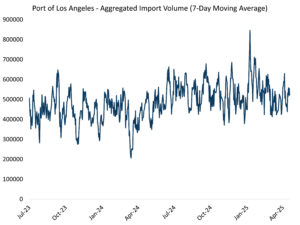
Source: IMF PortWatch, Sage
Rates for containers from Shanghai to LA have dropped significantly from elevated levels in 2024 and earlier this year as the demand for shipping has slowed for this key shipping route.
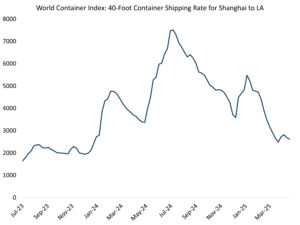
Source: Drewry, Sage
Container ship counts have also dropped sharply in April in concert with tariff uncertainty.
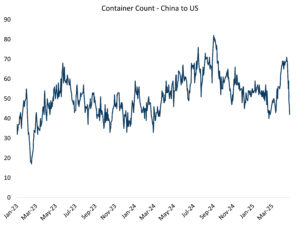
Source: Bloomberg, Sage
Forward-looking indicators are also signaling a sharp slowdown. Tariff uncertainty is clearly weighing on shippers as cancellations have increased and bookings have slowed. Blank capacity, which refers to a cancelled voyage or a skipped port call, has been increasing, indicating reduced shipping activity. Sea Intelligence reports a sharp increase in cancelled sailings over the coming weeks. The chart below illustrates the percentage of scheduled blank capacity relative to the planned capacity on the Asia-North America East Coast route. This data covers the period from March 24 to May 12, with each line representing which week of this year sailings were scheduled (weeks 12 through 16). The chart shows that the proportion of scheduled blank capacity has been increasing week by week, with a notable rise in May.
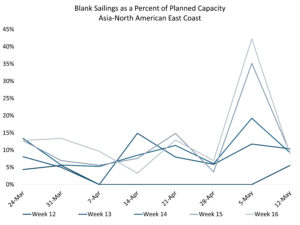
Source: Sea Intelligence, Sage
Bookings have also plummeted. Bookings of imports to the US fell 12.15% week-over-week and 22.37% year-over-year for the week of April 14th, after strong Q1 activity. Bookings from China to the US declined 22.14% week-over-week and are down 44.49% year-over-year, having fallen by 40% in the three weeks following Liberation Day.
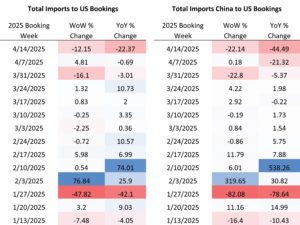
Source: Vizion, Sage
While tariffs have had a noticeable effect on shipping activity, particularly between the US and China, one positive readthrough is that imports jumped in the second half of 2024 and in the first quarter of this year in anticipation of damaging tariffs, which could delay the effects of the current US/China trade embargo on consumer prices and inventory levels. However, the longer this dynamic continues, the higher the probability of a supply shock and its subsequent effects on corporate margins and consumer prices. “Unsustainable” may have been the right characterization of the current state of trade between the US and China, which could continue to weigh on economic activity this year.
Disclosures: This is for informational purposes only and is not intended as investment advice or an offer or solicitation with respect to the purchase or sale of any security, strategy or investment product. Although the statements of fact, information, charts, analysis and data in this report have been obtained from, and are based upon, sources Sage believes to be reliable, we do not guarantee their accuracy, and the underlying information, data, figures and publicly available information has not been verified or audited for accuracy or completeness by Sage. Additionally, we do not represent that the information, data, analysis and charts are accurate or complete, and as such should not be relied upon as such. All results included in this report constitute Sage’s opinions as of the date of this report and are subject to change without notice due to various factors, such as market conditions. Investors should make their own decisions on investment strategies based on their specific investment objectives and financial circumstances. All investments contain risk and may lose value. Past performance is not a guarantee of future results.
Sage Advisory Services, Ltd. Co. is a registered investment adviser that provides investment management services for a variety of institutions and high net worth individuals. For additional information on Sage and its investment management services, please view our web site at sageadvisory.com, or refer to our Form ADV, which is available upon request by calling 512.327.5530.