Now is the Time to Reduce BBB Credit Risk to Protect Against Principle Loss

by Jeffrey Timlin

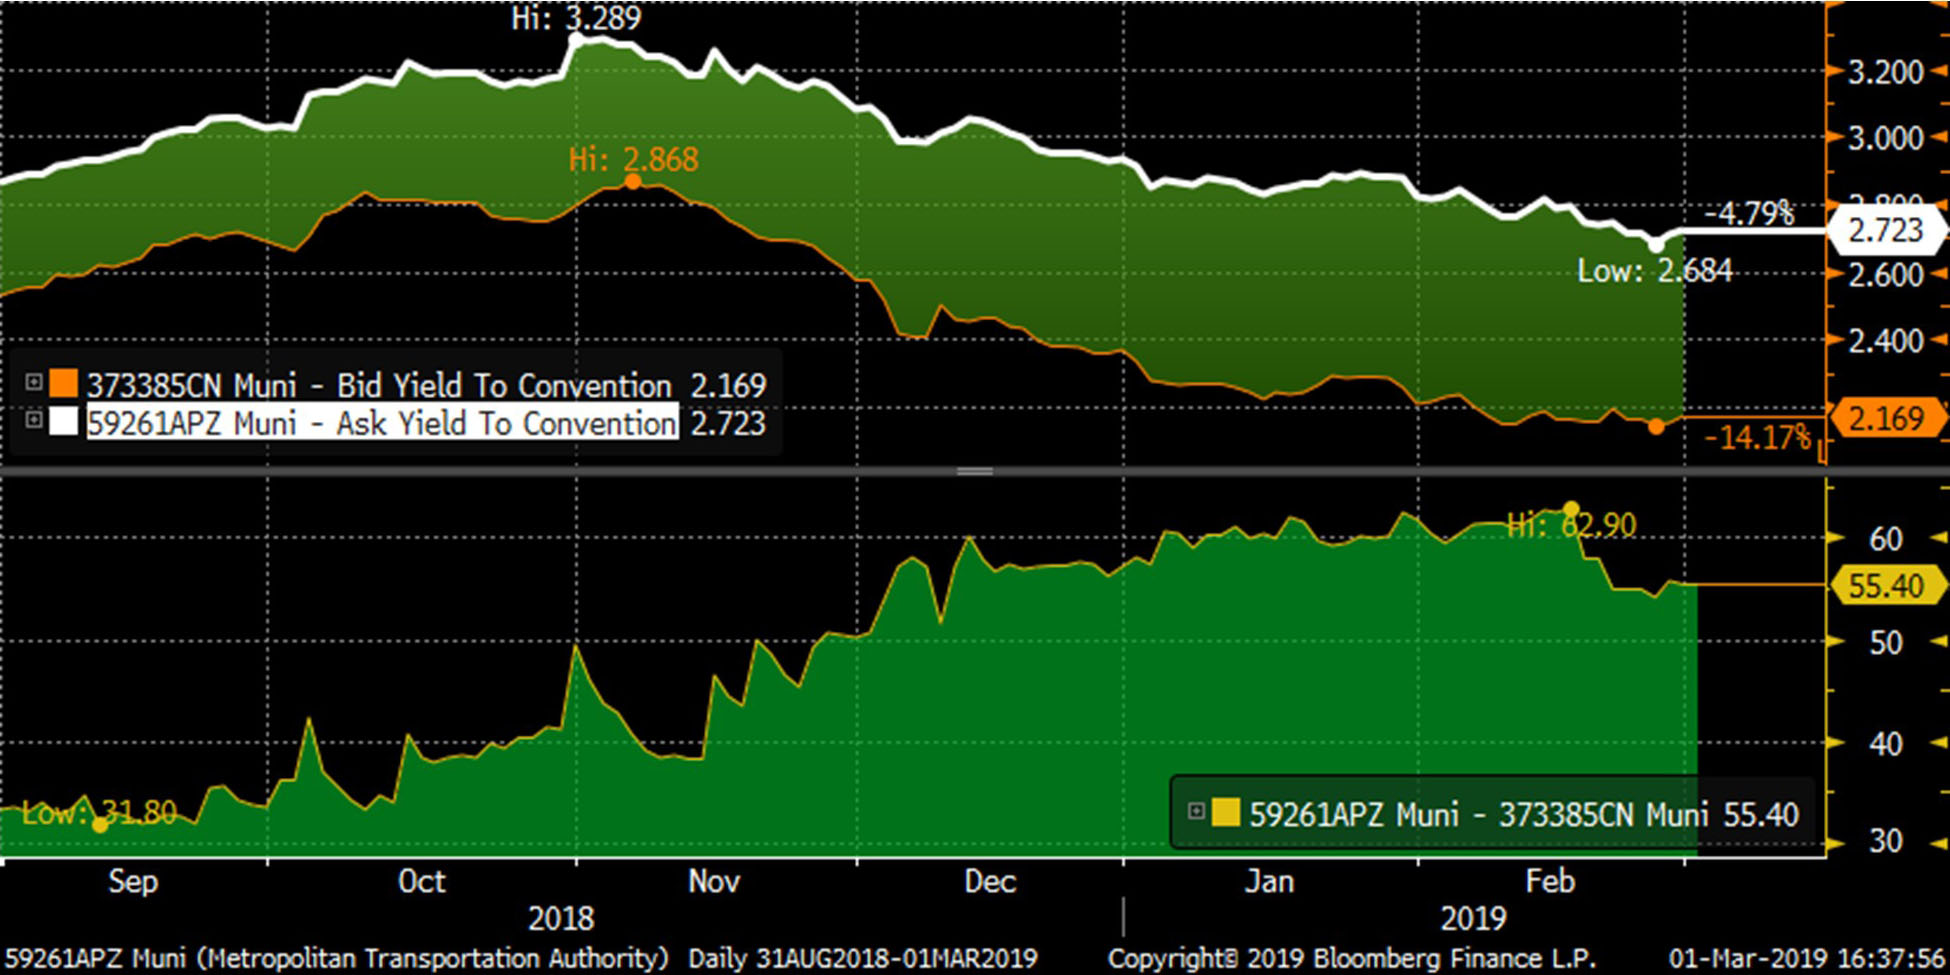
Due to an extremely strong technical environment, municipal yields have experienced a significant decline from the highs of 2018. In addition, credit spreads have tightened to historic lows and offer limited income reward relative to the risk of principal loss. A powerful portfolio management tool that Sage utilizes to optimize risk and reward characteristics is spread valuation analysis. In a historically wide spread environment, Sage would be allocating a larger percentage of the portfolio to lower-rated credits, due to the advantageous income environment. Alternatively, when spreads are near their historic low, Sage will reduce exposure to lower-rated credits to lock in positive returns as well as protect against principal loss.

As show in the chart, the additional spread that municipal investors are offered for owning BBB-rated bonds over Single A-rated bonds is currently 70 bps. Although this may seem attractive from a yield/income perspective, the probability of principle loss remains elevated.
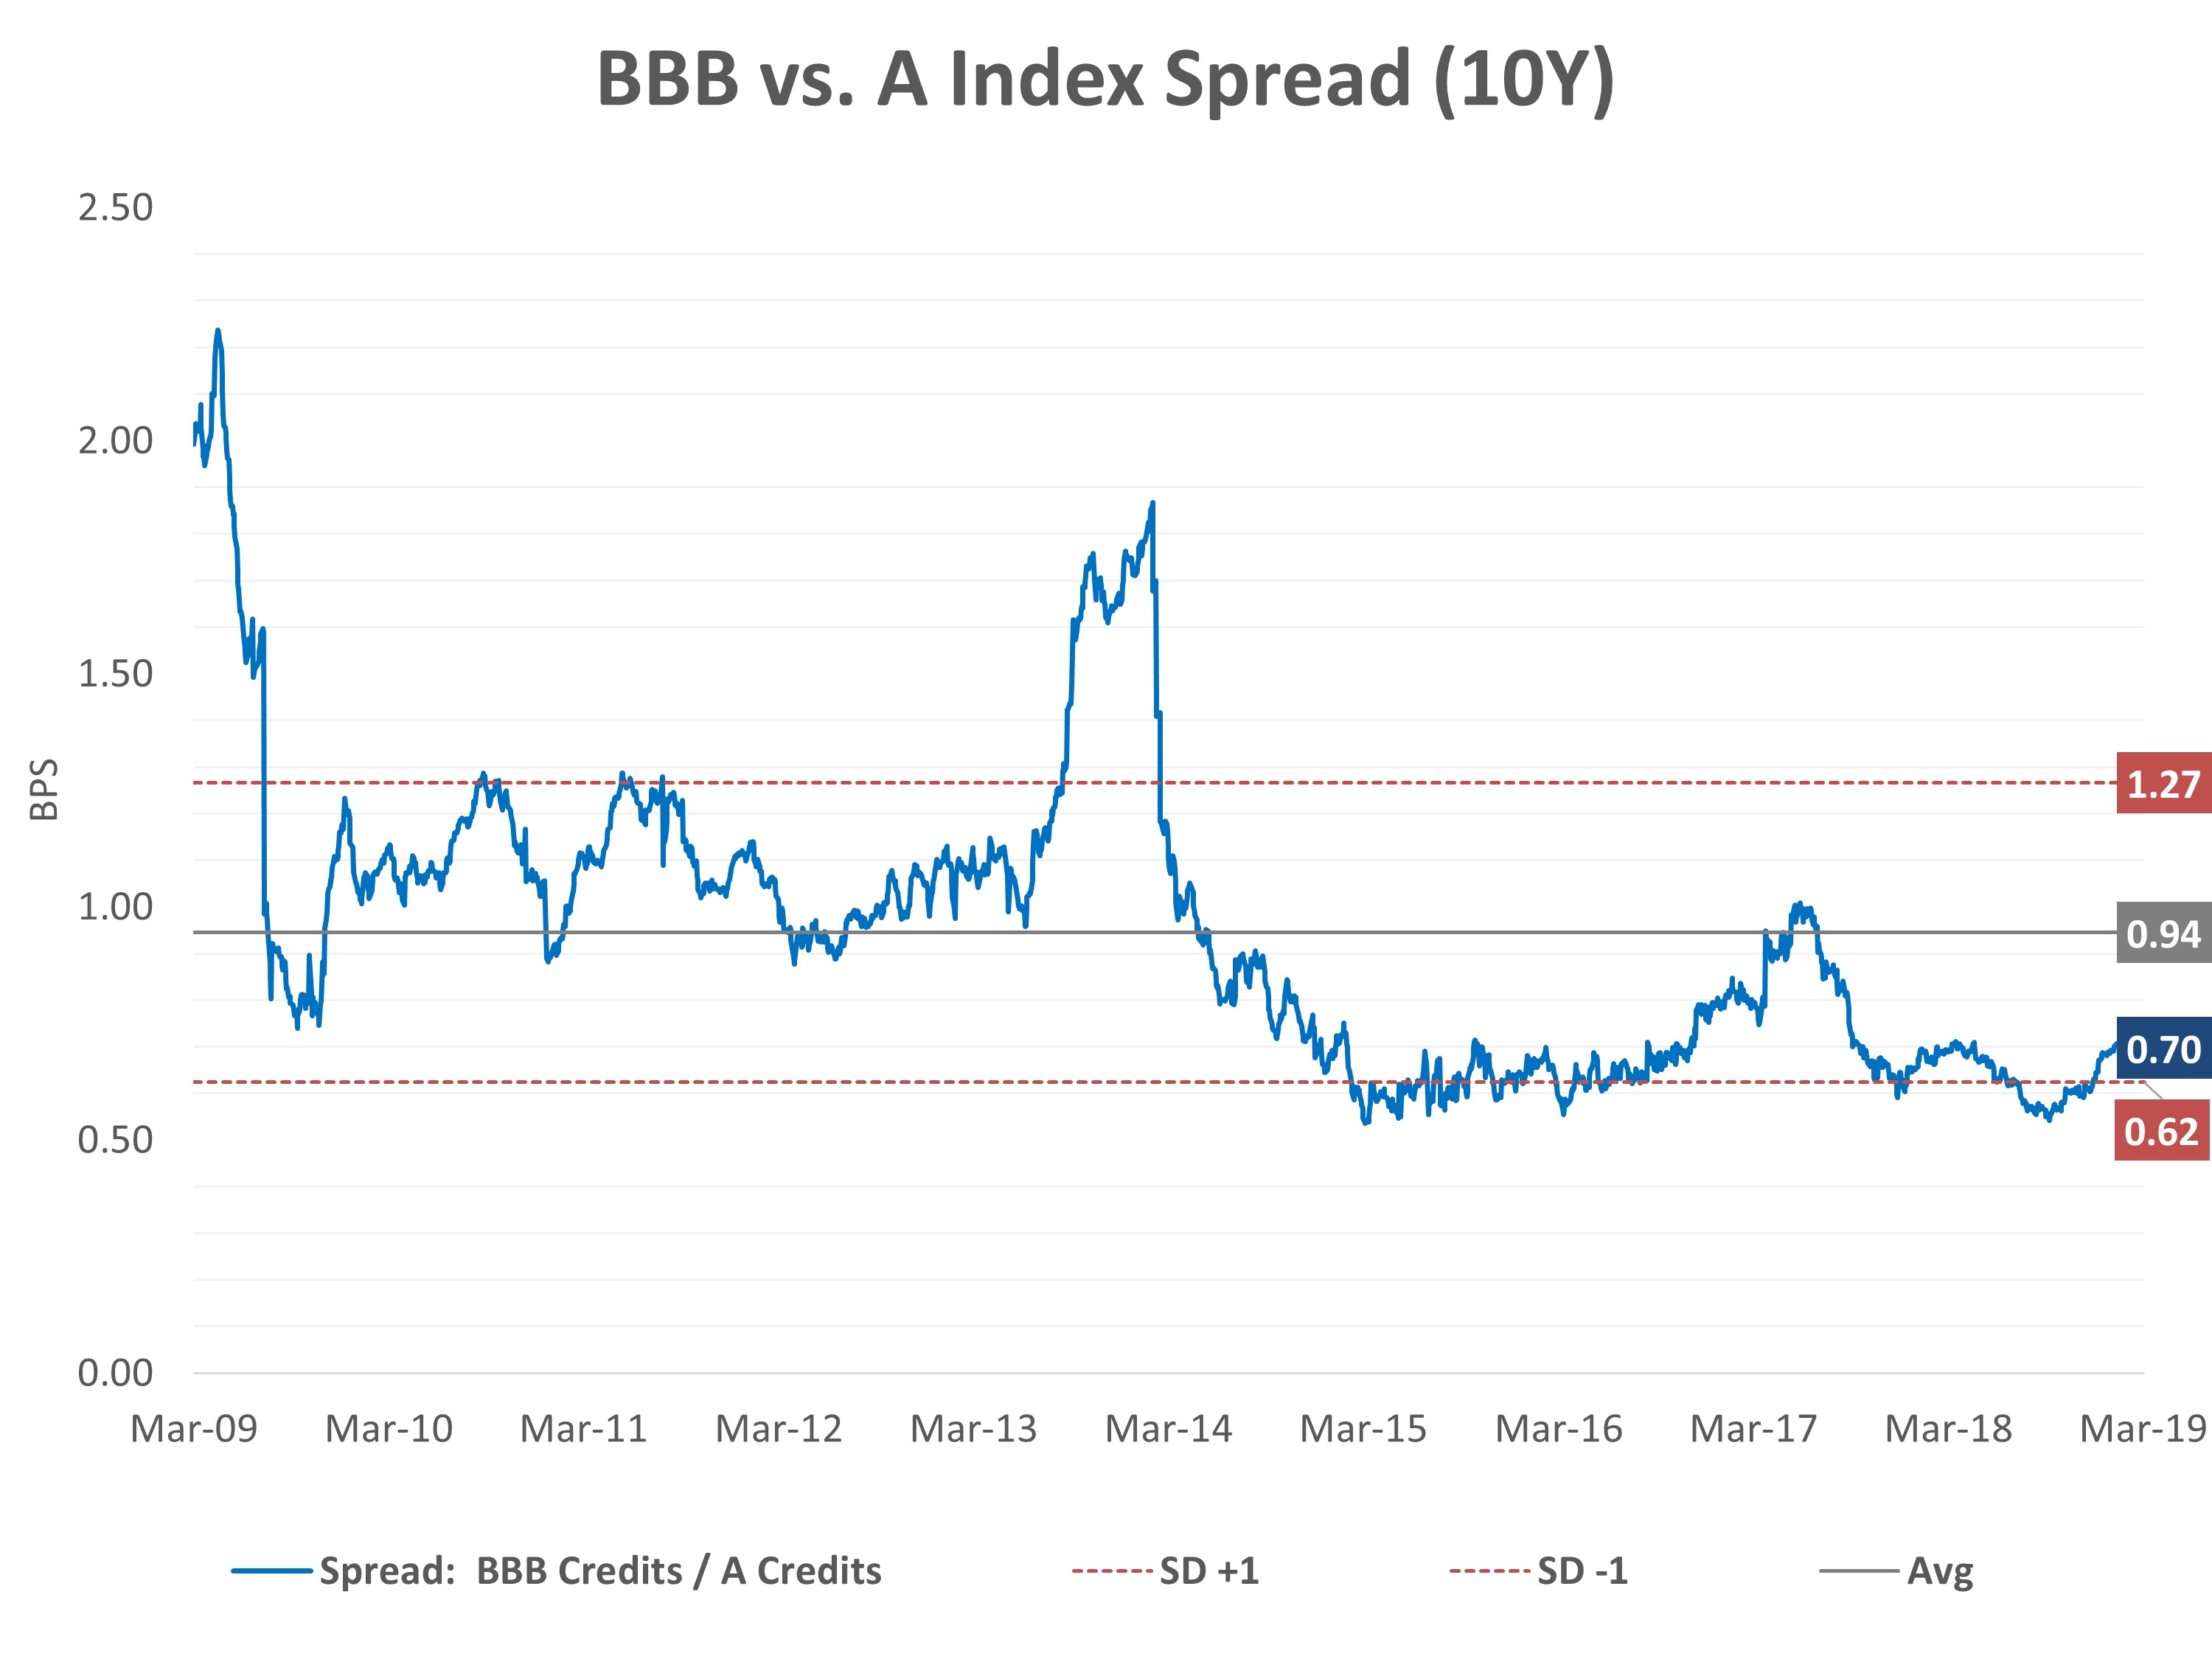
 

Source: Bloomberg


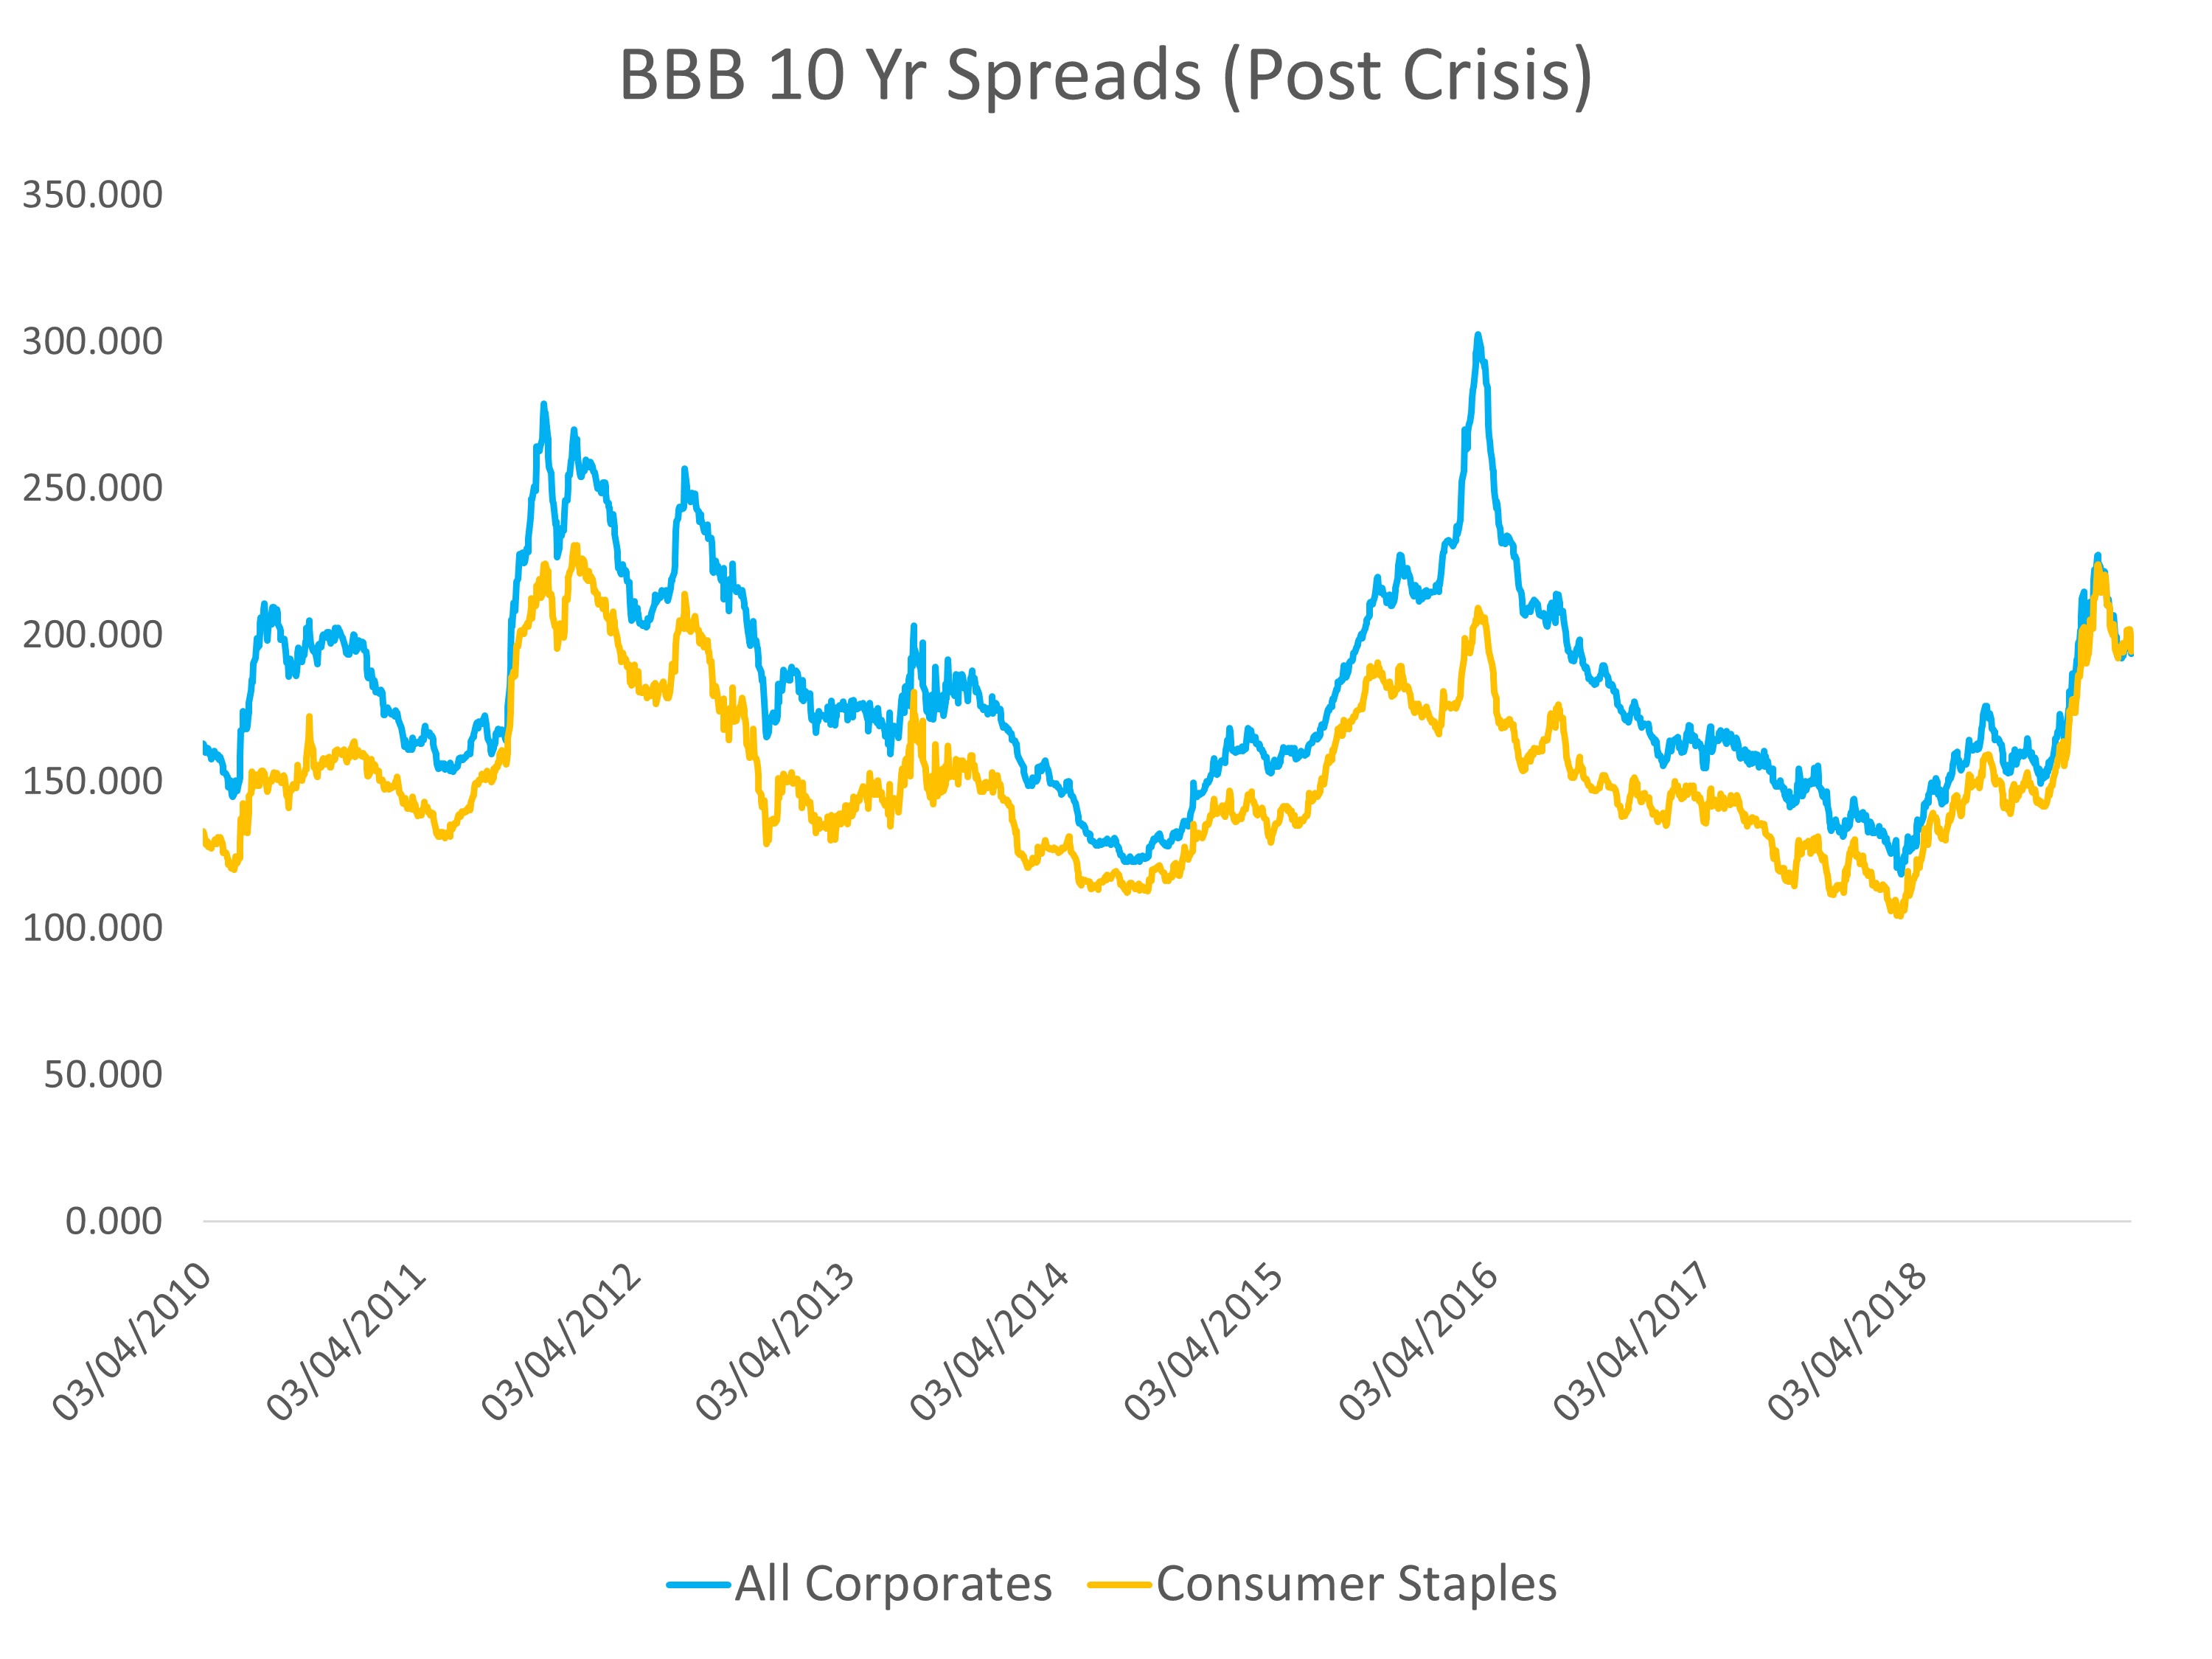
As an example, let’s take a generic BBB-rated bond with a five-year maturity, a 5.00% coupon and a four-year duration. If BBB spreads quickly revert to the 94-basis point average (shown in gray), the principle loss relative to a comparable A-rated bond would almost be 1.00%. However, if BBB bonds trade back towards the upper end of their historic range (127 bps shown in red), the principle loss under this scenario would be approximately 2.25%. For an investor looking to reduce credit risk and who can accept a slight-to-modest reduction in income, reducing exposure to BBB bonds and swapping into higher-rated credits seems like an advantageous tactical trade until the technical environment normalizes.


Disclosures: This is for informational purposes only and is not intended as investment advice or an offer or solicitation with respect to the purchase or sale of any security, strategy or investment product. Although the statements of fact, information, charts, analysis and data in this report have been obtained from, and are based upon, sources Sage believes to be reliable, we do not guarantee their accuracy, and the underlying information, data, figures and publicly available information has not been verified or audited for accuracy or completeness by Sage. Additionally, we do not represent that the information, data, analysis and charts are accurate or complete, and as such should not be relied upon as such. All results included in this report constitute Sage’s opinions as of the date of this report and are subject to change without notice due to various factors, such as market conditions. Investors should make their own decisions on investment strategies based on their specific investment objectives and financial circumstances. All investments contain risk and may lose value. Past performance is not a guarantee of future results.

Sage Advisory Services, Ltd. Co. is a registered investment adviser that provides investment management services for a variety of institutions and high net worth individuals. For additional information on Sage and its investment management services, please view our web site at www.sageadvisory.com, or refer to our Form ADV, which is available upon request by calling 512.327.5530.

Putting Trade into Context: Sage’s Outlook on Emerging Markets

For over a year, U.S.-China trade tensions have seized investor sentiment and dominated headlines. While tariffs and a potential resolution to the current episode are important for near-term price action, it’s only one piece of the puzzle. At Sage, we take a broader view on China and trade to determine our outlook for Asia and its effect on emerging markets (EM).

The fundamental issue facing global growth is that the source of China’s economic growth is changing. The country is shifting its growth model from one of exports and fixed investment spending to consumption-led growth. Officials have attempted to rein in China’s debt levels from the high credit growth of the past 15 years, which should result in a lower, but sustainable rate of growth. U.S. exports are a relatively small contribution to Chinese GDP, and the risk of trade tensions has been more about how it could affect business and investor sentiment than the impact on economic growth. The threat of tariffs was a catalyst for last year’s EM selloff, but those risks have been mitigated given a potential trade agreement between the U.S. and China in the coming months.

When we look past trade tensions, the underlying issue is that the Chinese economy is in a material slowdown. The chart below shows global manufacturing activity as measured by the Purchasing Managers’ Index, a common leading economic indicator. Chinese manufacturing activity has slowed to a level that indicates an economic contraction.


Chinese policymakers have responded with fiscal stimulus but have yet to introduce a liquidity injection to boost the property sector, which was China’s playbook for 2016. While the recent stimulus measures will help, its “impulse,” the effect that it will have on the Chinese economy, may not materialize for six or more months.

China is a huge trading partner to other EM countries, such as Taiwan and Korea, and recent figures from those countries have shown the magnitude of the Chinese slowdown.


In addition, commodity exporters, such as Chile, Australia, South Africa, and Brazil, have seen exports decline in recent months. These export numbers are a bellwether to growth in Asia and have the potential to hurt investor sentiment for EM assets.

Given recent strength in EM equities, particularly China, we have decided to underweight emerging markets throughout our equities, fixed income, and asset allocation strategies. The risk to this view is twofold: 1) flows moving into China due to index inclusion (MSCI) and investor demand, and 2) the economy responding positively to recent stimulus or a trade agreement in the near term (0-6 months). Ultimately, we believe these outcomes are improbable given the rapid buildup of flows and the current extreme positive sentiment surrounding EM assets.


The source for both charts are Bloomberg and Sage, as of 3/13/19.

Disclosures: This is for informational purposes only and is not intended as investment advice or an offer or solicitation with respect to the purchase or sale of any security, strategy or investment product. Although the statements of fact, information, charts, analysis and data in this report have been obtained from, and are based upon, sources Sage believes to be reliable, we do not guarantee their accuracy, and the underlying information, data, figures and publicly available information has not been verified or audited for accuracy or completeness by Sage. Additionally, we do not represent that the information, data, analysis and charts are accurate or complete, and as such should not be relied upon as such. All results included in this report constitute Sage’s opinions as of the date of this report and are subject to change without notice due to various factors, such as market conditions. Investors should make their own decisions on investment strategies based on their specific investment objectives and financial circumstances. All investments contain risk and may lose value. Past performance is not a guarantee of future results.

Sage Advisory Services, Ltd. Co. is a registered investment adviser that provides investment management services for a variety of institutions and high net worth individuals. For additional information on Sage and its investment management services, please view our web site at www.sageadvisory.com, or refer to our Form ADV, which is available upon request by calling 512.327.5530.

A Reason to Love the MTA

Due in part to ongoing fiscal challenges, New York’s Metropolitan Transportation Authority (MTA) bonds are currently trading at attractive levels. At 55 bps over comparable AAA bonds, 10-year MTA bonds rated A1 by Moody’s offers investors an opportunity to pick up some additional yield without significant credit risk.

As one the oldest and largest transportation networks in the U.S., the authority remains a vital part of New York’s infrastructure and an essential component of commuting for New York, New Jersey, and Connecticut residents. Despite structural deficiencies, Governor Andrew Cuomo, Mayor Bill de Blasio, and many other local leaders are heavily invested in the ongoing success of the MTA. A recent 10-Point Plan to transform and fund the MTA has significant support from both parties. For those who can handle modest credit risk and a bit of spread volatility, MTA bonds offer a good entry point.

As shown below, by selling out of 10 Yr AAA Georgia State GOs (cusip 373385CN) at a 2.17% yield and purchasing 10 Yr A1 MTAs (cusip 59261APZ) at a 2.72% yield, an investor can capture 55 bps of additional income with the same duration/interest rate risk.


Disclosures: This is for informational purposes only and is not intended as investment advice or an offer or solicitation with respect to the purchase or sale of any security, strategy or investment product. Although the statements of fact, information, charts, analysis and data in this report have been obtained from, and are based upon, sources Sage believes to be reliable, we do not guarantee their accuracy, and the underlying information, data, figures and publicly available information has not been verified or audited for accuracy or completeness by Sage. Additionally, we do not represent that the information, data, analysis and charts are accurate or complete, and as such should not be relied upon as such. All results included in this report constitute Sage’s opinions as of the date of this report and are subject to change without notice due to various factors, such as market conditions. Investors should make their own decisions on investment strategies based on their specific investment objectives and financial circumstances. All investments contain risk and may lose value. Past performance is not a guarantee of future results.

Sage Advisory Services, Ltd. Co. is a registered investment adviser that provides investment management services for a variety of institutions and high net worth individuals. For additional information on Sage and its investment management services, please view our web site at www.sageadvisory.com, or refer to our Form ADV, which is available upon request by calling 512.327.5530.

Consumer Staples is No Longer a Safe Harbor for Bond Investors

Not so long ago, Consumer Staples was one of the safest sectors for corporate bond investors. The sector was filled with companies that were known for steady growth and strong margins. They produced items that consumers wanted no matter the state of the economy, including cigarettes, beer, and classic food items like soup, pretzels, and cookies.  The sector may not have always been the most cutting-edge, but investors could count on the issuers in the Consumer Staples sector to deliver consistent cash flows that made buying their debt relatively less risky.  Secular declines in demand for some of these products, combined with more aggressive financial policies spurred by a wave of consolidation have conspired to destroy this narrative. Investors have taken notice. Once one of the “tighter” trading sectors of the corporate bond market, Consumer Staples companies now have spreads that are in line or, in many cases, even wider than other companies in traditionally more volatile sectors, such as Energy and Technology.


The two major phenomena that have pushed spreads wider in this sector are, of course, related: waning product demand and heightened M&A activity. Health awareness has contributed to slowing sales growth in alcohol, cigarettes, and sugary soft drinks. Sales growth has declined significantly for some companies, forcing many corporate management teams to reevaluate their options for producing the profit growth that equity investors demand.


To increase profits, one option that has become increasingly popular with the C-suite executives of these companies is leveraging M&A transactions.  Companies have looked to buy smaller competitors with faster-growing products or combined with similarly-sized peers, adding debt on top of the balance sheet while trying to cut costs via elimination of redundancies. These efforts have had mixed results at best, and at worst have taken long-time blue-chip debt issuers from the being considered stable investment grade outfits to the precipice of junk bond territory.

A high-profile example of this type of failure is the combination of Kraft Foods and H.J. Heinz Co. into The Kraft Heinz Company (KHC). Since the leveraged merger took place in 2015, the combined company’s stock has lost 50% of its value and the entity’s bond ratings have sunken to low BBB, one step away from a junk rating.  The deal had the backing of an impressive roster of investors, including Warren Buffett, who believed in the long-term demand for the products they sold and the company’s ability to cut costs and drive cash flow growth enough to trim the large debt burden created by the merger.

Sage follows a universe of benchmark issuers within the Consumer Staples space that echoes this story. Many issuers are carrying significantly larger debt balances while seeing slowing top-line revenue growth. The group has seen average leverage increase from 2.5x in 2015, to 3.2x currently, especially significant given that traditionally the 3x leverage level was a considered a key guidepost for the difference between an investment grade and a high-yield rating from Moody’s or S&P.


At Sage, we have become less sanguine on the prospects for the Consumer Staples sector at large, and within the sector we prefer lower-risk credits that have avoided the temptation to issue excessive debt for mergers designed to spur sales growth. Clorox (CLX) and Colgate-Palmolive (CL) exemplify this discipline, while companies such as Kraft-Heinz, Campbell Soup Co. (CPB), and Anheuser-Busch InBev (BUD) have all the characteristics we’d prefer to avoid.


The source on all charts is Bloomberg.

Disclosures: This is for informational purposes only and is not intended as investment advice or an offer or solicitation with respect to the purchase or sale of any security, strategy or investment product. Although the statements of fact, information, charts, analysis and data in this report have been obtained from, and are based upon, sources Sage believes to be reliable, we do not guarantee their accuracy, and the underlying information, data, figures and publicly available information has not been verified or audited for accuracy or completeness by Sage. Additionally, we do not represent that the information, data, analysis and charts are accurate or complete, and as such should not be relied upon as such. All results included in this report constitute Sage’s opinions as of the date of this report and are subject to change without notice due to various factors, such as market conditions. Investors should make their own decisions on investment strategies based on their specific investment objectives and financial circumstances. All investments contain risk and may lose value. Past performance is not a guarantee of future results.

Sage Advisory Services, Ltd. Co. is a registered investment adviser that provides investment management services for a variety of institutions and high net worth individuals. For additional information on Sage and its investment management services, please view our web site at www.sageadvisory.com, or refer to our Form ADV, which is available upon request by calling 512.327.5530.

February Fixed Income Outlook in 5 Charts

1. By pausing rate hikes and slowing quantitative tightening, the Federal Reserve has supported equities and other risk assets; valuations have since moved back to fair territory after the January rally. This chart illustrates how the Fed’s policy reactions have corresponded with the direction of equity markets.


2. The fourth quarter provided an excellent opportunity to add credit exposure as markets became too aggressive in pricing in recession concerns. Supportive technical indicators and higher yields suggest credit has further room to outperform.


3. Downward pressure on rates caused by a more dovish Fed and weakening global growth is being offset by continued balance sheet runoff and moderate growth in the U.S. Rates are likely to be rangebound in the near-term.


4. A strong housing market coupled with a rangebound outlook for interest rates are supportive of an allocation to mortgage pass-throughs.


5. Bullish sentiment, yield carry, and valuation data suggest now is the time to hold an allocation to select non-core fixed income sectors, such as emerging markets.


The source for all charts is Bloomberg.

Disclosures: This is for informational purposes only and is not intended as investment advice or an offer or solicitation with respect to the purchase or sale of any security, strategy or investment product. Although the statements of fact, information, charts, analysis and data in this report have been obtained from, and are based upon, sources Sage believes to be reliable, we do not guarantee their accuracy, and the underlying information, data, figures and publicly available information has not been verified or audited for accuracy or completeness by Sage. Additionally, we do not represent that the information, data, analysis and charts are accurate or complete, and as such should not be relied upon as such. All results included in this report constitute Sage’s opinions as of the date of this report and are subject to change without notice due to various factors, such as market conditions. Investors should make their own decisions on investment strategies based on their specific investment objectives and financial circumstances. All investments contain risk and may lose value. Past performance is not a guarantee of future results.

Sage Advisory Services, Ltd. Co. is a registered investment adviser that provides investment management services for a variety of institutions and high net worth individuals. For additional information on Sage and its investment management services, please view our web site at www.sageadvisory.com, or refer to our Form ADV, which is available upon request by calling 512.327.5530.

The Four Seasons of Muni Bond Investing

Timing is everything. For a municipal bond investor, annual seasonal trends can provide great entry and exit points, if executed properly. There are four distinct seasonal periods that occur annually due to structural factors inherent in the municipal bond market. If timed correctly, municipal investors can increase their probability of successfully trading these markets and reap the reward of better returns.

The four seasonal periods that affect the municipal market on an annual basis are January Reinvestment, Tax Season, June/July Redemptions, and the Holiday Season Slowdown.

January Reinvestment

Although not the heaviest period of bond maturity and coupon payments, January 1st does experience an elevated level of cash that needs to be reinvested. In addition, the lingering effects of the Holiday Season Slowdown contribute to a limited amount of new issue supply, as well as diminished levels of secondary supply offered by broker/dealers. This strong technical environment tends to last anywhere from a few weeks to well into February, depending on the direction and magnitude of market flows. For investors who can time liquidity needs, January represents one of the most advantageous times of year to raise funds.

Tax Season – late March through April

From late March until the end of April, the municipal bond market tends to see both a reduction in demand as well as a heightened level of selling to fund tax payments. (Selling tax-exempt municipal bonds to fund personal federal and state tax liabilities remains one of life’s great mysteries.) Regardless, tax season provides an attractive entry point for investors, as limited demand and improving new issue supply tend to push valuations to more attractive levels.

June/July Redemptions

The heaviest period of maturing bonds and coupon payments is during these two months and represents anywhere from 40% to 60% of annual redemptions. Typically, municipal issuers come to market during this time, which offsets the demand pressure from reinvestment. Unfortunately, over the past several years, municipalities have been paying down debt and reducing debt issuance, which has created a net negative supply environment. As long as new issuance remains below the long-term averages, municipal bonds will remain supportive during June and July and provide investors an opportune time to rebalance portfolios (such as reducing credit risk).

Holiday Season – late November through year-end

Thanksgiving should indicate a warning sign to investors regarding optimal liquidity and ample supply. During the week of Thanksgiving, the markets may be open; however, the focus of the market is limited. The last week of November and the first two weeks of December represent the final opportunity for investors to efficiently trade before the market essentially shuts down for the year. Junior traders and reduced staff remain the norm during the last two weeks of the year. Market making and risk taking are severely restricted and a noticeable liquidity premium on bonds is apparent. Fortunately, for those investors looking to put cash to work, the ability to purchase bonds from forced market sells offers the opportunity to add exposure at discounted levels.

Sage has always believed that a well-informed investor is a successful investor. Investors looking to make strategic and tactical shifts into and out of municipal bonds can enhance returns by timing seasonal effects appropriately. By combining Sage’s value-based investment strategy with seasonal timing of cash flow, investors will be able to maximize market liquidity and optimize return potential.


Disclosures: This is for informational purposes only and is not intended as investment advice or an offer or solicitation with respect to the purchase or sale of any security, strategy or investment product. Although the statements of fact, information, charts, analysis and data in this report have been obtained from, and are based upon, sources Sage believes to be reliable, we do not guarantee their accuracy, and the underlying information, data, figures and publicly available information has not been verified or audited for accuracy or completeness by Sage. Additionally, we do not represent that the information, data, analysis and charts are accurate or complete, and as such should not be relied upon as such. All results included in this report constitute Sage’s opinions as of the date of this report and are subject to change without notice due to various factors, such as market conditions. Investors should make their own decisions on investment strategies based on their specific investment objectives and financial circumstances. All investments contain risk and may lose value. Past performance is not a guarantee of future results.

Sage Advisory Services, Ltd. Co. is a registered investment adviser that provides investment management services for a variety of institutions and high net worth individuals. For additional information on Sage and its investment management services, please view our web site at www.sageadvisory.com, or refer to our Form ADV, which is available upon request by calling 512.327.5530.


Valuations Become Attractive for Longer-Maturity Municipal Bonds

With investor demand focused on the front end of the yield curve, longer maturities have been neglected, leading to a divergence from Treasury yield movements. We believe valuations for long-dated municipal bonds offer the high-taxed individual an attractive entry point here.

The 30-Year Municipal to Treasury ratio, M/T for short, is a common valuation indicator that can easily spot undervalued and overvalued market conditions. As of early February, the 30-Year M/T ratio was greater than 100%, which has historically been a great time to enter the market.


The benefit to taxable investors is that current 30-year municipal yields are offered at the same yield level as equivalent Treasuries. For an investor with a 35% effective tax rate, the after-tax benefit for owning municipal bonds equates to approximately 1.00% of additional yield. If investors can withstand a modest level of price volatility, extending the maturity profile of a portfolio’s bond allocation will pay dividends over time.


Disclosures: This is for informational purposes only and is not intended as investment advice or an offer or solicitation with respect to the purchase or sale of any security, strategy or investment product. Although the statements of fact, information, charts, analysis and data in this report have been obtained from, and are based upon, sources Sage believes to be reliable, we do not guarantee their accuracy, and the underlying information, data, figures and publicly available information has not been verified or audited for accuracy or completeness by Sage. Additionally, we do not represent that the information, data, analysis and charts are accurate or complete, and as such should not be relied upon as such. All results included in this report constitute Sage’s opinions as of the date of this report and are subject to change without notice due to various factors, such as market conditions. Investors should make their own decisions on investment strategies based on their specific investment objectives and financial circumstances. All investments contain risk and may lose value. Past performance is not a guarantee of future results.

Sage Advisory Services, Ltd. Co. is a registered investment adviser that provides investment management services for a variety of institutions and high net worth individuals. For additional information on Sage and its investment management services, please view our web site at www.sageadvisory.com, or refer to our Form ADV, which is available upon request by calling 512.327.5530.

Risk-Based Capital — Fixed Income Takes Center Stage

February 7, 2019 — The National Association of Insurance Commissioners (NAIC) is seeking to implement changes to risk-based capital (RBC) requirements for fixed income, leading to potentially surprising and significant increases in capital needs. This calls for more immediate and detailed portfolio assessments coupled with a plan for efficient repositioning and implementation. Insurers should consider leveraging the combined fixed income and insurance specializations at Sage to construct portfolios that are capital efficient and remain aligned with their overall business objectives.

Notes from the Desk: Central Banks Are No Longer a Major Pain Point

With the interest rate markets pricing in no hikes for 2019, there was room for the FOMC to disappoint at its January meeting; however, they ended up surpassing the most dovish of expectations. As a result, risk assets rallied sharply in January as global central banks followed in the Fed’s footsteps in easing financial conditions.

In his statements, Chairman Powell signaled that the case for additional rate hikes had weakened and declined to rule out that the next move in rates would be lower. Most importantly, the Fed said that it was prepared to adjust its balance sheet normalization to economic and financial developments. Basically, if raising rates or lowering the size of the Fed’s balance sheet turns out to negatively affect markets, Powell and the FOMC would adjust policy as necessary.

Thus resumes the cycle of central bank policy acting in response to financial markets. The chart below shows the 12-month forward federal funds rate compared to the S&P 500. Expectations of Fed policy have traded in lockstep with the equity markets.


Given our focus on balance sheet policy as a source of risk asset fragility, this action removes a major point of uncertainty for financial markets over the next few months. We’re still wary of a material slowing in the global economy, but as of this week – it doesn’t look like central banks will be part of the problem.


Disclosures: This is for informational purposes only and is not intended as investment advice or an offer or solicitation with respect to the purchase or sale of any security, strategy or investment product. Although the statements of fact, information, charts, analysis and data in this report have been obtained from, and are based upon, sources Sage believes to be reliable, we do not guarantee their accuracy, and the underlying information, data, figures and publicly available information has not been verified or audited for accuracy or completeness by Sage. Additionally, we do not represent that the information, data, analysis and charts are accurate or complete, and as such should not be relied upon as such. All results included in this report constitute Sage’s opinions as of the date of this report and are subject to change without notice due to various factors, such as market conditions. Investors should make their own decisions on investment strategies based on their specific investment objectives and financial circumstances. All investments contain risk and may lose value. Past performance is not a guarantee of future results.

Sage Advisory Services, Ltd. Co. is a registered investment adviser that provides investment management services for a variety of institutions and high net worth individuals. For additional information on Sage and its investment management services, please view our web site at www.sageadvisory.com, or refer to our Form ADV, which is available upon request by calling 512.327.5530.

Pensions: Don’t Repeat Mistakes of the Past

In 2019, by most accounts, corporate defined benefit (DB) plans are pretty well-funded. Their equity allocations benefited from the 10-year bull market, and their liabilities have come down as interest rates have risen from their post-crisis lows. Higher assets plus lower liabilities equals better funding levels.

But since these favorable conditions will not last forever, the prudent next step is for plans to lock in their high funding levels. In other words, prepare now for the next downturn.

The 2008 Financial Crisis devastated the pension industry, partly because many well-funded plans were too heavily weighted toward risky assets. Since the crisis, corporate plans have done a good job repairing their level of funding. The Milliman 100 Pension Funding Index, which projects the funded status of the 100 largest U.S. corporate DB plans, ended 2018 at roughly 90% funded. But 2018 also provided evidence that markets can reverse quickly. Equity markets suffered double-digit losses, and the Milliman index dropped 4.5% from its peak in September.

Source: Milliman, as of 12/31/2018

Even though most corporate pension plans lost ground in the fourth quarter, it’s important to note that the Milliman index, at 90% funded, is still 20% higher than it was in August 2010. For plans that have successfully rebuilt their funding, we recommend a shift from capital-appreciation mode to capital-preservation mode. This means reducing allocations to risk-seeking assets (such as equities) and transitioning to more liability-driven investments.

Sage tailors liability-driven investment portfolios to the specific liabilities of DB plans. That means no two LDI portfolios are identical. Well-designed LDI strategies should keep duration and volatility levels in-line with their liability benchmarks and serve as effective hedges against interest rate risk. As interest rates rise or fall, LDI portfolios should minimize volatility of the plan’s funded status.

For plans that choose not to hedge against market volatility, the result could be larger required contributions during the next market downturn. It is not a question of if, but when.


Disclosures: This is for informational purposes only and is not intended as investment advice or an offer or solicitation with respect to the purchase or sale of any security, strategy or investment product. Although the statements of fact, information, charts, analysis and data in this report have been obtained from, and are based upon, sources Sage believes to be reliable, we do not guarantee their accuracy, and the underlying information, data, figures and publicly available information has not been verified or audited for accuracy or completeness by Sage. Additionally, we do not represent that the information, data, analysis and charts are accurate or complete, and as such should not be relied upon as such. All results included in this report constitute Sage’s opinions as of the date of this report and are subject to change without notice due to various factors, such as market conditions. Investors should make their own decisions on investment strategies based on their specific investment objectives and financial circumstances. All investments contain risk and may lose value. Past performance is not a guarantee of future results.

Sage Advisory Services, Ltd. Co. is a registered investment adviser that provides investment management services for a variety of institutions and high net worth individuals. For additional information on Sage and its investment management services, please view our web site at www.sageadvisory.com, or refer to our Form ADV, which is available upon request by calling 512.327.5530.