
Peering Under the Hood of Auto and Credit Card ABS: Insights into US Consumer Resilience
March 17, 2025 By Sage Advisory
In previous Notes, we have explored asset-backed securities (ABS) backed by data centers and critical AI infrastructure. In this week’s edition, we shift our focus to another critical segment of the ABS market: those tied to consumer loans, such as credit cards and auto loans. Despite recent weakness, the long-term health of the US consumer remains robust, and this resilience is mirrored in the performance of ABS, which have benefited from significant structural changes in underwriting standards and ABS structures.
ABS derive their value from a pool of underlying cash flow-generating assets, such as loans, leases, or credit card balances. The process of creating ABS is known as securitization, where a financial institution bundles assets into a portfolio, separates the aggregated assets into sections called “tranches,” and then sells them to investors. This structure allows the issuer to convert illiquid assets into marketable securities, providing a steady stream of income to investors while enabling the issuer to raise funds.
One common method to structure an ABS is credit tranching, where the ABS are divided into different layers or “tranches,” each with varying levels of risk and return. The most senior tranches, often rated AAA, have the highest credit protection and are the first to receive payments, making them the safest portion in the structure. Subordinate tranches, which bear losses first, offer higher returns to compensate for their increased risk. Other credit enhancement techniques include overcollateralization, where the value of the underlying assets exceeds the value of the issued securities, and excess spread, which uses the difference between the interest earned on the assets and the interest paid to investors as a buffer against potential losses. These structures help ensure that ABS remain attractive to a wide range of investors by balancing risk and return.
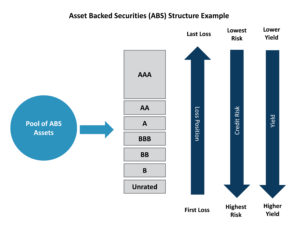
Source: Sage
Credit card and auto loan ABS offer a unique lens into consumer spending habits and financial health. By analyzing the performance and delinquency trends of these strategies, investors can gain insights into the real economy. For instance, an increase in credit card ABS issuance might indicate higher consumer spending and confidence, while a rise in auto loan ABS could reflect strong demand for vehicle financing. Softening economic conditions could result in higher delinquency and weaker credit fundamentals, which could appear in assets underlying these ABS.
In recent years, while delinquencies and defaults have been rising across most ABS sectors, taking a long-term perspective is important to provide context. Below is the history of charge-offs (a term for when a lender deems a debt unlikely to be repaid) for credit card ABS, which peaked during the financial crisis near 11%. Over the following 15 years, charge-offs declined to a low of approximately 1% during 2021 and have been trending up ever since – but are still at only 2%. In addition, due to the securitization structure of these securities, the highest quality AAA-rated credit card receivables did not take on any losses, even at the highest delinquency levels during the GFC. Auto loan delinquency trends are largely similar, with weighted average net loss rates rising to levels last seen in 2019 in both prime and subprime categories.
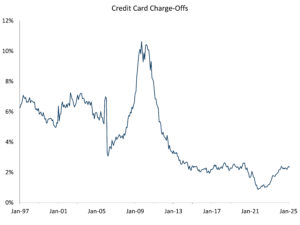
Source: JPMorgan
As the US economy gradually cools from its robust post-pandemic recovery, which was driven by substantial monetary and fiscal stimulus, the resilience of the US consumer remains evident. This strength is supported by some of the healthiest household balance sheets observed over the long term. Furthermore, asset-backed securities, particularly the highest-quality tranches, remain robust due to their enhanced credit protection features, which should contribute to the sector’s stability amid uncertain economic conditions.
Disclosures: This is for informational purposes only and is not intended as investment advice or an offer or solicitation with respect to the purchase or sale of any security, strategy or investment product. Although the statements of fact, information, charts, analysis and data in this report have been obtained from, and are based upon, sources Sage believes to be reliable, we do not guarantee their accuracy, and the underlying information, data, figures and publicly available information has not been verified or audited for accuracy or completeness by Sage. Additionally, we do not represent that the information, data, analysis and charts are accurate or complete, and as such should not be relied upon as such. All results included in this report constitute Sage’s opinions as of the date of this report and are subject to change without notice due to various factors, such as market conditions. Investors should make their own decisions on investment strategies based on their specific investment objectives and financial circumstances. All investments contain risk and may lose value. Past performance is not a guarantee of future results.
Sage Advisory Services, Ltd. Co. is a registered investment adviser that provides investment management services for a variety of institutions and high net worth individuals. For additional information on Sage and its investment management services, please view our web site at sageadvisory.com, or refer to our Form ADV, which is available upon request by calling 512.327.5530.