The 2020 Presidential Election and Markets – 5 Things Investors Need to Know

by Rob Williams, Director of Research

We expect the continued economic recovery to be a driver of market returns overall and putting the uncertainty of elections behind us will be positive for risk assets such as equities. In the meantime, as we enter the height of election season, investors should consider how the following factors will affect markets.

1) Expect a tight race and continued volatility. Biden maintains a lead over Trump in the voting polls, but the lead has shrunk as the economic recovery gained momentum and markets moved higher.


Source: Bloomberg

Trump’s polling gap is highly dependent on Covid-19 cases. Recent market volatility and an uptick in new cases is likely to keep Trump trailing into the election, but close enough to keep results highly uncertain.

Source: Bloomberg

2) Historical data is a mixed bag. Historical election and market return data tells us that immediate post-election market returns have not favored either party; both parties have had strong positive and negative return regimes over both short and longer periods. While the incumbent president has typically had the advantage, 13 vs. 10 wins, this is not so during recessions, where the incumbent has lost 4 out of 5 times.


Source: Bloomberg
 

3) Contested results will cause market volatility. A contested election/delayed results is something investors should be considering and would likely result in at least a temporary risk-off scenario. The 2000 election is the nearest example we have of a delayed result, when the Supreme Court ultimately halted recounts and declared a winner. The result of the uncertainty was lower interest rates and weaker equities, with performance favoring international, value-oriented equities and longer-duration fixed income.

Source: Bloomberg

4) Trade policy will be impactful and doesn’t depend on either party controlling Congress. The handling of trade policy will be one of the key differences between candidates and doesn’t require a shift in Congress to be implemented. Harsh rhetoric and tariffs during the China/U.S. trade war weighed on international returns, especially China and emerging market Asia. Status quo results may continue to favor the U.S., while a Biden victory could bolster relative international returns.

Source: Bloomberg

5) Both parties will focus on pro-growth policies, and the Fed will be the more important driver of interest rates. The following table provides color on how markets would respond depending on the winning candidate.

Source: Bloomberg


Disclosures: This is for informational purposes only and is not intended as investment advice or an offer or solicitation with respect to the purchase or sale of any security, strategy or investment product. Although the statements of fact, information, charts, analysis and data in this report have been obtained from, and are based upon, sources Sage believes to be reliable, we do not guarantee their accuracy, and the underlying information, data, figures and publicly available information has not been verified or audited for accuracy or completeness by Sage. Additionally, we do not represent that the information, data, analysis and charts are accurate or complete, and as such should not be relied upon as such. All results included in this report constitute Sage’s opinions as of the date of this report and are subject to change without notice due to various factors, such as market conditions. Investors should make their own decisions on investment strategies based on their specific investment objectives and financial circumstances. All investments contain risk and may lose value. Past performance is not a guarantee of future results.

Sage Advisory Services, Ltd. Co. is a registered investment adviser that provides investment management services for a variety of institutions and high net worth individuals. For additional information on Sage and its investment management services, please view our web site at www.sageadvisory.com, or refer to our Form ADV, which is available upon request by calling 512.327.5530.


Notes From the Desk – Credit Spread Dispersion Between Cyclical and Non-Cyclical Industries Reveals Opportunities

As summer draws to a close, the U.S. economy continues to stage a dramatic recovery. While equities have responded by powering through all-time highs, corporate credit spreads flatlined in August. The level of spreads tells only one part of the story in credit, however, and they are not reflective of the high level of dispersion that persists within the corporate bond universe, namely among cyclical and non-cyclical sectors. This leads us to believe there are opportunities among select issuers that could lead to additional return over the coming months. Breaking out the corporate universe into cyclicals and non-cyclicals reveals a more nascent recovery in names that were the most adversely affected by COVID-19 in August. Given our macro outlook of continued recovery, we believe credit spreads of consumer cyclical sectors, such as autos and logistics companies, have room to compress toward the overall index spread.

The most recent slate of economic data paints a picture of a V-shaped recovery as supply chains come back online, particularly in the consumer goods sector. Manufacturing PMIs have recovered above pre-COVID-19 levels and new orders are at a 16-year high. Additionally, gasoline demand has recovered to pre-COVID-19 levels, signaling a return to mobility after widespread lockdown and an increase in the flow of goods in the economy. These data points along with several others, including housing, autos, and trade activity, supports our view of a continued recovery in the coming months.

Manufacturing PMI/New Orders

Source: Bloomberg

Gasoline Demand

Source: Department of Energy, Bloomberg

Turning to credit valuations, we believe a strong rebound in economic data will create a tailwind for the consumer cyclical sectors within the corporate bond universe. The current spread differential of consumer cyclical versus non-cyclical sectors recently touched a multi-year high and has only recently displayed signs of compressing tighter after pausing in mid-June due to fears of a COVID-19 second wave.

Spread Differential, Consumer Cyclicals vs. Non-Cyclical Corporate Bonds

Source: Sage, Bloomberg

Although overall valuations of the corporate bond universe have rebounded from March lows, we believe that when one looks “under the hood,” select consumer cyclical sectors, such as autos and logistics companies, have room to rally on an absolute basis and relative to non-cyclical sectors. To that end, we have initiated overweight positions in issuers within those industries.


Download the full post here.


Disclosures: This is for informational purposes only and is not intended as investment advice or an offer or solicitation with respect to the purchase or sale of any security, strategy or investment product. Although the statements of fact, information, charts, analysis and data in this report have been obtained from, and are based upon, sources Sage believes to be reliable, we do not guarantee their accuracy, and the underlying information, data, figures and publicly available information has not been verified or audited for accuracy or completeness by Sage. Additionally, we do not represent that the information, data, analysis and charts are accurate or complete, and as such should not be relied upon as such. All results included in this report constitute Sage’s opinions as of the date of this report and are subject to change without notice due to various factors, such as market conditions. Investors should make their own decisions on investment strategies based on their specific investment objectives and financial circumstances. All investments contain risk and may lose value. Past performance is not a guarantee of future results.

Sage Advisory Services, Ltd. Co. is a registered investment adviser that provides investment management services for a variety of institutions and high net worth individuals. For additional information on Sage and its investment management services, please view our web site at www.sageadvisory.com, or refer to our Form ADV, which is available upon request by calling 512.327.5530.

Notes from the Desk — Fed Support Creates Strong Risk-On Environment

To help restore liquidity and reduce panic among investors at the depths of the coronavirus crisis, the Federal Reserve enacted several measures in late March. One such step was the implementation of a corporate bond buying program. The $750 billion facility was originally intended to only allow for purchases of bonds from companies that could attest that they were under severe stress, so few companies opted in.

Despite the requirements of the program, credit spreads retraced most of the move wider from March, to settle in the 140 bps to 150bps range, well within the long-term average range.

And the funding costs of corporate borrowers are now actually lower than before due to a dramatic decrease in rates because of the resumption of quantitative easing. Consequently, the average coupon rates of investment grade bonds now sit at 3.89%, well below levels seen in February prior to the COVID-19 shutdowns.

With credit markets stabilized and lower funding costs for IG borrowers, bond investors have moved back into “risk on” mode.

Curiously, the Federal Reserve decided to dramatically expand the scope of its corporate bond buying program on June 15, well after markets had stabilized. The Fed indicated that the goal was to ensure corporate borrowers could access the primary markets for funding, but that goal had long since been accomplished. Why then did the Fed decide to drastically increase the size of the program by eliminating the need for companies to self-identify as “distressed?” The answer may lie in a more esoteric part of the credit markets that is typically the domain of investment bankers.

Bridge Loans

Bridge loans are typically non-public loans with shorter maturities that are designed to “bridge” the gap between an M&A event (e.g., a large acquisition) and the pricing of public bonds in the primary market that will finance the debt portion of the M&A event. These loans are usually syndicated by a small group of investment banks that each agree to provide some portion of the funds in exchange for substantial underwriting fees.

The bridge loan is used as a necessary short-term source of funding necessary to get the deal done, and typically the borrower will issue bonds a later date after a deal “roadshow” to allow public bond investors to become comfortable with the credit profile of the combined entity. In exchange for this short-term funding, borrowers will typically pay banks steep fees and higher interest rates than would be typical for such a short duration loan (usually one year or less). Consequently, this is a very profitable business for large investment banks.

The downside for the banks is the unlikely scenario where the bridge loan becomes “hung.” This refers to when a deal is agreed upon and bridge financing is secured, but between the normally short period where the bridge loan is funded and when the borrower can successfully launch a new primary bond issue the credit environment changes materially. This situation perfectly describes several large bridge loan deals that were funded with the year prior to February 2020. Without strong enthusiasm for high-yield credit risk, several of these deals would not have been able to price high-yield bonds to take out the bridge financing and the investment banks that participated in the bridge deal would be left with illiquid, stressed loans to credits that could not re-finance their short-term debt in favor of longer-dated high-yield bonds.

The following is a list of some high-profile syndicated bridge loans that would likely have ended up “hung” without help from the Fed’s liquidity infusion. These deals in aggregate account for tens of billions of dollars of credit risk for investment banks, a situation that could have easily soured the balance sheets of these banks with little recourse.

T-Mobile-Sprint

  • Size: $19bn
  • Structure: Covenant-light bridge loan
  • Term: 364 days
  • Use of Proceeds: To finance the acquisition of Sprint
  • Banks Involved: Barclays, Credit Suisse, Deutsche Bank, Goldman Sachs, Morgan Stanley, RBC, US Bank, Wells Fargo, and others

El Dorado Resorts

  • Size: $1.8bn
  • Structure: Covenant-light bridge loan
  • Term: 364 days
  • Use of Proceeds: To finance the acquisition of Caesar’s Entertainment
  • Banks Involved: JP Morgan, Credit Suisse, MacQuarie

Elanco Animal Health

  • Size: $2.75bn
  • Structure: Bridge loan
  • Term: 364 days
  • Use of Proceeds: To finance the acquisition of Bayer’s animal health business
  • Banks Involved: Goldman Sachs

WESCO International

  • Size: $3.125bn
  • Structure: Unsecured bridge loan
  • Term: 364 days
  • Use of Proceeds: To finance the acquisition of Anixter International
  • Banks Involved: Barclays, US Bank


Implications for Investors

This action by the Fed should encourage investors to think more broadly in terms of risk allocations. A well-functioning high-yield bond and leveraged loan market points to a strong “risk on” environment for investors, and there are opportunities to invest in bonds that are still below intrinsic value despite the rally in credit spreads in April and May. Investors that may have been worried about an extreme liquidity crunch grinding public credit markets to a halt should take comfort in knowing the Fed seems prepared to do whatever is necessary to maintain liquidity and keep spread volatility to a minimum for the remainder of 2020.


Disclosures: This is for informational purposes only and is not intended as investment advice or an offer or solicitation with respect to the purchase or sale of any security, strategy or investment product. Although the statements of fact, information, charts, analysis and data in this report have been obtained from, and are based upon, sources Sage believes to be reliable, we do not guarantee their accuracy, and the underlying information, data, figures and publicly available information has not been verified or audited for accuracy or completeness by Sage. Additionally, we do not represent that the information, data, analysis and charts are accurate or complete, and as such should not be relied upon as such. All results included in this report constitute Sage’s opinions as of the date of this report and are subject to change without notice due to various factors, such as market conditions. Investors should make their own decisions on investment strategies based on their specific investment objectives and financial circumstances. All investments contain risk and may lose value. Past performance is not a guarantee of future results.

Sage Advisory Services, Ltd. Co. is a registered investment adviser that provides investment management services for a variety of institutions and high net worth individuals. For additional information on Sage and its investment management services, please view our web site at www.sageadvisory.com, or refer to our Form ADV, which is available upon request by calling 512.327.5530.

A Tipping Point in ESG ETFs?

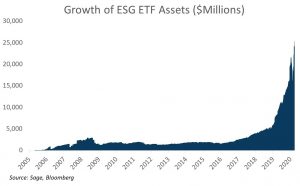
Environmental, Social, and Governance (ESG)-oriented ETFs took off in 2005 with the launch of the iShares MSCI USA ESG Select ETF, with a little over $20 million in assets. It took 14 years for ESG ETF assets to reach $5 billion, and just 18 more months to get to $25 billion. What happened?

Sustainable investing has been around for decades but it was initially focused on pockets of the investment ecosystem, did not have widespread adoption, and was mainly focused on strategies that excluded areas of the markets that didn’t align with the investors’ values. It was about five years ago that large institutional investors began to consider ESG, media coverage increased, and the growth of standardized ESG data contributed to the adoption of ESG into the investment mainstream. At that time, there were two main questions with regard to ESG investing:

  • First, will all the buzz around ESG result in asset flows?
  • Second, by adopting a sustainable investment strategy, does the investor forgo return relative to a conventional strategy?

In this Perspectives piece, we use ETF flow and performance data from the past 12 months to give clarity on flows into ESG investments, which have gained steam in 2020 and could be foreshadowing a tipping point for flows into ESG strategies. As an example, while ESG-oriented ETFs represent only 0.8% of the $6 trillion of U.S.-listed equity ETFs, they have accounted for over 30% of ETF inflows thus far in 2020!

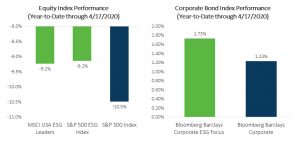
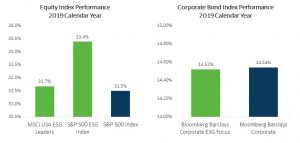
We also highlight performance – an ESG strategy does not result in inferior returns versus a conventional index. In fact, over the past 12 months – in which we’ve seen equities make all-time highs as well as the fastest bear market in history — ESG strategies have largely outperformed the most popular conventional passive ETFs.

Ultimately, we believe the acceleration in flows into ESG ETF assets are a result of three factors: first, the continued trend toward values-based investing, which has been spurred further by the COVID-19 and oil crises this year. Second, the breadth of investment options has reached critical mass – the average investor now can access most public asset classes through ETFs. Lastly, investors have been able to observe the performance of ESG ETFs through historic bear and bull markets in the last three years alone, and the returns so far have been favorable to ESG strategies relative to conventional passive indexes and ETFs.

Fund Flows – The Hype is Real

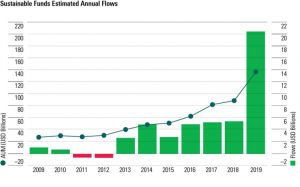
The inflow of funds into ESG ETFs, primarily in equities, has picked up steam in the past 12 months to an AUM base of $25.2 billion as of April 30, 2020. Just to put that into perspective, it took ESG ETFs a little under two years to go from zero to $1 billion in assets, 12 more years to reach $5 billion in assets, and then just 18 months to reach a $25 billion AUM mark! The chart below shows the growth of ESG ETF assets over time.

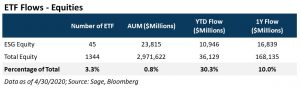
The recent wave of asset flows has been concentrated in equities, which account for the bulk of the ETF equity flows thus far in 2020. The table below shows flows of ESG ETFs versus the larger ETF universe in both equities and fixed income. While ESG Equity ETFs represent 0.8% of total equity ETF assets, they have accounted for over 30% of all equity ETF flows thus far in 2020!

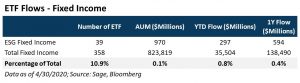
The ESG fixed income space tells a different story. In 2020, fixed income ESG ETF inflows have remained modest. We believe that the slower adoption of fixed income relative to equity ETFs is to be expected as the ETF market in fixed income is smaller in terms of assets and the number of ETFs. However, as ESG investing continues to pick up steam as we have seen in equities, we believe that most asset classes and fund types should benefit from this trend.

ESG Performance – Through Thick and Thin

Investors now have enough of a sample size to judge how ESG-oriented strategies perform in both euphoric bull markets and deep bear markets. The past three years in markets have alternated between a low volatility rally in 2017, a sharp drawdown in the fourth quarter of 2018, one of the best years for equity markets in 2019, and the fastest bear market in history in 1Q 2020 during the COVID-19 crisis. It truly has been an interesting “laboratory environment” for an investment strategy, and ESG thus far has shown robustness across different market environments.

In the tables below, we examine performance of the largest segment of ESG ETF assets, U.S. equities, versus the largest passive ETFs to gauge performance during those time periods. We found that ESG not only has kept up with conventional indexes, it has also been able to outperform, which we believe is a big reason for the recent inflows into the ESG category.

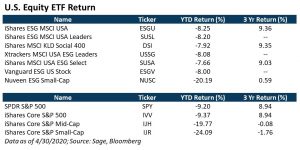
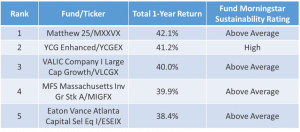
The table below displays the performance of some of the largest ESG Equity ETFs as well as the largest passive ETFs of conventional indexes in equities. On a YTD basis, the ESG ETFs have outperformed the largest S&P 500 ETFs, and even the Nuveen ESG Small Cap ETF, an ESG-oriented U.S. equity strategy, has outperformed the largest U.S. Small Cap ETF on a YTD and three-year basis.

In observing the recent performance of ESG strategies, investors are recognizing the advantages of a company with superior sustainability characteristics. A company that implements material ESG principles is often associated with properties of a “high-quality” company as defined in quantitative investing parlance: profitability, low volatility, and stable earnings. These properties of companies are rewarded by markets over time, especially during late-cycle environments and recessionary time periods.

A Sign of Things to Come – Growth Opportunities

In his bestselling book The Tipping Point, author Malcolm Gladwell defines a tipping point of a social trend as the following:

The tipping point is that magic moment when an idea, trend, or social behavior crosses a threshold, tips, and spreads like wildfire.

The discussion, anticipation, and importance of ESG over the past five years has seen a follow through in asset flows, and like many of the examples in Gladwell’s book, once a concept crosses the “threshold,” change happens rapidly, not gradually.

Sage is fully committed to the growth of ESG. We provide investors with ESG ETF models, an ESG corporate bond ETF (GUDB), and ESG fixed income strategies. As ESG remains a small fraction of the ETF and separate account markets, we see the most potential for growth in two main areas. First, ESG fixed income strategies, which are picking up flows but not to the scale of equity strategies, could see the same growth trajectory as equity ETF assets as fixed income funds continue to build a track record. Additionally, there is room for growth for ESG ETFs within the defined contribution space, where there is a dearth of ESG options in most 401(k) plans. With the millennial generation now becoming the largest investment cohort, the 401(k) choice architecture should evolve with the demographics and include more ESG strategies.


Disclosures: This is for informational purposes only and is not intended as investment advice or an offer or solicitation with respect to the purchase or sale of any security, strategy or investment product. Although the statements of fact, information, charts, analysis and data in this report have been obtained from, and are based upon, sources Sage believes to be reliable, we do not guarantee their accuracy, and the underlying information, data, figures and publicly available information has not been verified or audited for accuracy or completeness by Sage. Additionally, we do not represent that the information, data, analysis and charts are accurate or complete, and as such should not be relied upon as such. All results included in this report constitute Sage’s opinions as of the date of this report and are subject to change without notice due to various factors, such as market conditions. Investors should make their own decisions on investment strategies based on their specific investment objectives and financial circumstances. All investments contain risk and may lose value. Past performance is not a guarantee of future results.

Sage Advisory Services, Ltd. Co. is a registered investment adviser that provides investment management services for a variety of institutions and high net worth individuals. For additional information on Sage and its investment management services, please view our web site at www.sageadvisory.com, or refer to our Form ADV, which is available upon request by calling 512.327.5530.

Company Transparency in the Time of COVID-19: An Update on 3M’s Missteps

The N95 mask has become a symbol of the fight against COVID-19. Named for its ability to block 95% of airborne particles, it has become vitally important to protect health care workers fighting deadly viruses. In the wake of the COVID-19 pandemic, N95 masks are in dangerously short supply. Skyrocketing demand and diminishing supply have left health care providers caring for ill patients without protective personal equipment (PPE), such as the N95 masks, gloves, and surgical gowns. Many have reported being forced to ration or reuse PPE. Medical staff have even taken to social media to communicate the intensity of the situation, making #GetMePPE a trending topic. It has been estimated that fighting COVID-19 will require 3.5 billion masks in the U.S. alone.

Earlier this year we published a perspectives piece on 3M’s chemical industry and its involvement with PFAS (per- and polyfluoroalkyl substances) contamination. We called attention to the company’s questionable business ethics that were brought to light when it failed to effectively manage PFAS, leading to a decades-long national health crisis. However, 3M’s chemical branch only makes up less than a third of its revenue. The company has a diverse business model and is also a large producer of medical equipment and supplies, bringing 3M’s name to a multitude of national headlines over these past weeks. While several companies make N95 masks, 3M has a near monopoly on production. Other respirators that work to block 95% of airborne particles exist, but the FDA has only approved N95s for use in the U.S., putting 3M in a unique position of great responsibility.

Mark Cuban, owner of the Dallas Mavericks, has become an unlikely voice in advocating against PPE price gouging. When Cuban began digging into the N95 market, his goal was to get hospital workers the protective equipment they need. Instead, he found his inbox flooded with emails from distributors reselling masks with significant price markups – a normal N95 mask costs anywhere from $0.50-$1 –  Cuban was offered the masks at $8 each. 3M does not sell its masks directly to consumers, but rather uses licensed distributors as middlemen. While 3M has said it will not raise prices for medical equipment, a lack of supply, price consistency, and information have led to a free-for-all among companies wanting to resell the masks. This had led to extreme price gouging, with masks being sold at highly inflated prices – like the ones offered to Mark Cuban. State governors across the U.S. have reported being forced to partake in bidding wars for N95 masks, allowing states that can afford to pay the premium to take home the order.

When asked about distributor price gouging, a representative for 3M has said the company cannot control prices retailers and dealers charge for 3M products. A statement released by the company’s CEO Mike Roman promises that 3M will be working with federal and state governments to prevent price gouging and counterfeiting. Already, 3M has filed multiple lawsuits against those it has found profiteering; however, we find this situation reminiscent of 3M’s management of PFAS; the company has exhibited a stark lack of transparency and has failed to be proactive.

In normal circumstances, there is no reason 3M should not maintain its relationships with mask distributors – but these are not normal times. We believe 3M could have easily required distributors to sell directly to hospitals and health care providers, while threatening to end contracts with distributors who refused. 3M chose not to do so. Instead, for weeks the company sat on the sidelines while distributors increased prices and American health care providers went without PPE.

In late March, the Trump Administration invoked the Defense Production Act after it discovered that 3M was still exporting masks to Canada and Latin America. After determining that cutting off mask supplies to other countries would prove detrimental to the United States, 3M and the White House announced that the company will import 166.5 million respirators to the U.S. over the next three months while also continuing to fulfill foreign contracts. While the agreement was amicable, President Trump’s initial public frustration with 3M hurt the company’s brand image and could have been avoided if 3M had chosen to better communicate with the country about what is happening in the N95 mask market.

Beyond Scotchgard and Command Strips, 3M’s participation in the health care industry means the company has a duty to serve its stakeholders during this time to increase production of medical equipment and supplies and prevent price gouging and counterfeiting. 3M has worked to increase N95 capacity, but supply has not met demand and the company has not done enough to effectively combat price gouging. Lack of communication has led to wasted resources and time. We believe the company’s lack of transparency reinforces our view that 3M’s weak corporate governance presents material ESG risks that are unlikely to abate anytime soon.

Timeline of 3M’s Missteps


Disclosures: This is for informational purposes only and is not intended as investment advice or an offer or solicitation with respect to the purchase or sale of any security, strategy or investment product. Although the statements of fact, information, charts, analysis and data in this report have been obtained from, and are based upon, sources Sage believes to be reliable, we do not guarantee their accuracy, and the underlying information, data, figures and publicly available information has not been verified or audited for accuracy or completeness by Sage. Additionally, we do not represent that the information, data, analysis and charts are accurate or complete, and as such should not be relied upon as such. All results included in this report constitute Sage’s opinions as of the date of this report and are subject to change without notice due to various factors, such as market conditions. Investors should make their own decisions on investment strategies based on their specific investment objectives and financial circumstances. All investments contain risk and may lose value. Past performance is not a guarantee of future results.

Sage Advisory Services, Ltd. Co. is a registered investment adviser that provides investment management services for a variety of institutions and high net worth individuals. For additional information on Sage and its investment management services, please view our web site at www.sageadvisory.com, or refer to our Form ADV, which is available upon request by calling 512.327.5530.


On this Milestone Earth Day, there is No Better Time to Invest in ESG

Today marks the 50th anniversary of Earth Day, a worldwide event that recognizes our Earth’s resources are finite and deserve to be protected, and a day that jumpstarted the evolution of an investment philosophy we practice today called Environmental, Social, and Governance – ESG – investing.

Demand for ESG investments is on the rise, and the reason is simple: people want to invest in well-run companies that care about ALL their stakeholders and create a net positive effect on the environment. Companies that adhere to ESG principles and policies will outperform over the long-run – they are more sustainable. And in these uncertain times, people are reaching for what is sustainable.

During one of the worst economic shocks on record, the COVID-19 pandemic, which has been exacerbated by an oil price war, ESG investments have done better than their benchmarks.

In the first quarter of 2020, 70% of sustainable funds finished in the top half of their category across asset classes, and that was regardless of whether they were actively or passively managed, according to Morningstar.

In 2019, net flows to mutual funds and ETFs that received high sustainability ratings were $20.6 billion, almost four times net flows of $5.5 billion in 2018, according to Morningstar. Last year was also one of the best years for the S&P500 and a stellar year for fixed income, but investments that were optimized for ESG issues had even better returns.


Companies with higher ESG scores tend to be more profitable and have more resources to invest in ESG issues, and their earnings are less volatile. This in turn makes them better companies that are positioned to do well over the long-term.

For more on Sage ESG Investing, click here.

For more on Sage’s Sustainable Investment Policy, click here.


Sustainable Investing in the Age of COVID-19

As economies worldwide are reeling from COVID-19, the pandemic is shining a light on companies that truly embrace ESG principles. At Sage we will be closely watching the impact companies’ Environmental, Social, and Governance policies have during this unprecedented time. To gain a better understanding of the ESG factors that are relevant right now, we’ve provided some examples below.

(E) Environmental Impact

If there is one area that has seen some positive results as a result of the pandemic, it is the environment. Cleaner air and a decline in carbon emissions due to travel restrictions, as well as cleaner water as a result of the absence of normal boat traffic have been signs of a healthier environment. Prior to COVID-19, climate change risk concerns had been increasing among the ESG investing community and had gained greater weight in ESG analysis. Unfortunately, many of the positive environmental benefits engendered by COVID-19 have not been the result of active company management; however, they have brought awareness of climate change to audiences beyond ESG. It is our hope that once the dust settles companies will actively manage the ways they can lessen their carbon footprint, whether that be by telecommuting, less business air travel, offsetting carbon emissions, etc.

(S) Social Impact

Companies across industries are struggling to operate and are being forced to let go of employees as a result of significant losses. As of Monday, April 20, 22 million people have filed for unemployment, with the current unemployment rate inching near a whopping 18% of the U.S. workforce.

From an investment standpoint, people should be paying a close eye to the companies taking swift, supportive actions for their employees. Some franchises, major conglomerates, and even small businesses are still finding ways to pay their employees, whether through CEO pay cuts or loan payouts while their doors remain shut for now.

With “stay-at-home” orders remaining in place across the United States, working from home has become the new norm for many businesses, potentially changing the future of offices forever. Companies that support their employees during this time will be closely watched by ESG investors.

(G) Governance Impact

From managing business risk, to customer and employee relations, to implementing policies and procedures, how companies are making decisions at the executive level will demonstrate to investors who is making a difference.

We are seeing companies across industries going above and beyond to support health care workers and all essential employees. Car manufacturing companies such as Ford, Tesla and GM have mobilized, making ventilators and other medical devices for the Strategic National Stockpile. Fashion designers and luxury labels have also stepped up, helping overcome shortages of masks and other personal protective equipment (PPE) in some of the hardest-hit countries.

Taking efforts such as these during such a challenging time will demonstrate a company’s core values, and in turn, significantly boost investor sentiment (and companies that do not, may incur irreparable brand damage). The more involved and responsible companies become amid this pandemic, the higher their sustainability will be long-term.

Coronavirus relief efforts have an enormous impact on investing this Earth Day. It is evident that companies with high ESG ratings have been proactive in taking action against the pandemic. Insight into the higher-rated ESG companies shows us the values investors are seeking at this time; including trust, transparency, creativity, authenticity, and communication.

Embracing Sustainability’s Silver Linings on this Earth Day

Today’s Earth Day celebrations will certainly look different than years past; however, that does not mean we should not celebrate. Let’s continue to highlight companies that are doing all they can to continue to follow ESG policies, from protecting the environment, employees, and customers, to holding their leaders accountable to make a difference.


Listen to Bob Smith, President & CIO, talk with Jill Malandrino of Nasdaq TradeTalks about ESG performance amid COVID-19.

To read our recent Highlights and Holdings, case studies on companies that garner high ESG scores, see:

AbbVie

Coca-Cola

VF Corporation

Marsh & McLennan Companies


Disclosures: This is for informational purposes only and is not intended as investment advice or an offer or solicitation with respect to the purchase or sale of any security, strategy or investment product. Although the statements of fact, information, charts, analysis and data in this report have been obtained from, and are based upon, sources Sage believes to be reliable, we do not guarantee their accuracy, and the underlying information, data, figures and publicly available information has not been verified or audited for accuracy or completeness by Sage. Additionally, we do not represent that the information, data, analysis and charts are accurate or complete, and as such should not be relied upon as such. All results included in this report constitute Sage’s opinions as of the date of this report and are subject to change without notice due to various factors, such as market conditions. Investors should make their own decisions on investment strategies based on their specific investment objectives and financial circumstances. All investments contain risk and may lose value. Past performance is not a guarantee of future results.

Sage Advisory Services, Ltd. Co. is a registered investment adviser that provides investment management services for a variety of institutions and high net worth individuals. For additional information on Sage and its investment management services, please view our web site at www.sageadvisory.com, or refer to our Form ADV, which is available upon request by calling 512.327.5530.


Making Sense of Fed Policy During COVID-19

The Fed’s response to the economy and market breakdown engendered by the COVID-19 crisis has been unprecedented — not only in scale, but how quickly new policy tools have been used to address rapidly tightening financial conditions. The following is a short post intended to demystify the “alphabet soup” of Fed tools and what each tool is trying to fix, and provide a list of additional policies we can reasonably expect in the near-term.

A global health crisis ultimately requires a scientific solution, but earlier this month within the span of days, the health crisis morphed into economic stress (with the uncontained spread of COVID-19 in Italy), and eventually threatened to become a full-blown financial crisis (after the OPEC oil shock on March 7). Ultimately, the intensity of the Fed’s policy tools was targeted at containing and preventing market stresses from turning into a financial crisis while the world dealt with COVID-19.


Notable policy tools the Fed has employed thus far include:

Interest Rates Cut to Zero

The Fed has cut rates to zero, first on March 3 by 50 basis points, and by a further 100 basis points on Sunday, March 14. As market stresses intensified effects on short-term fixed income both in the U.S. and overseas, which was caused by interest rate differentials, the FOMC had to cut rates to zero two days before its scheduled March meeting, underscoring the urgency of the situation.

Unlimited Quantitative Easing (QE)

The Fed started a $700 billion QE program on March 14, and nine days later, it expanded the size of QE to be open-ended. To put this into perspective, after the global financial crisis (GFC), the span of QE1 to QE3 took 5 years. It took only nine days for the Fed to expand QE to be open-ended. Put another way, the Fed will buy more assets this week than it bought post-GFC during the years 2010 to 2012.


Commercial Paper Funding Facility (CPFF)

In order to support the commercial paper market, which is a short-term funding vehicle for the corporate sector that seized up last week, the Fed announced a $100 billion purchase program backed by $10 billion of funds to cover loan losses from the U.S. Treasury’s Exchange Stabilization Fund (ESF) (typically used to intervene in foreign exchange markets).

Money Market Mutual Fund Liquidity Facility (MMLF)

On March 18, the Fed created the MMLF to lend money to banks so that they can purchase assets from money market mutual funds, supporting functioning of the money markets. Again, this program is $100 billion in size, backed by $10 billion from the U.S. Treasury’s ESF.

Corporate Credit Facility (PMCCF, SMCCF)

On March 23, the Fed created two vehicles to purchase corporate bonds in both the primary and secondary markets. Notably, the Fed announced the purchase of corporate bond ETFs. This program to buy IG corporates was truly a new tool (not used during the GFC), which has calmed credit markets in the near term. The total size of this program is $300 billion, backed by $30 billion from the ESF.

Term Asset-Backed Loan Facility (TALF)

Also on March 23, the Fed established the TALF to buy asset-backed securities that are backed by auto, student, or small business loans. The capacity of this vehicle is included in the $300 billion to buy corporates and ETFs.


Our takeaways and expectation for future policy:

The Fed and U.S. Treasury are in coordination, and thus, monetary and fiscal policy are one.

The Fed is in the fiscal arena now. By creating vehicles to effectively support the debt markets and make loans to businesses backed by the U.S. Treasury, the Fed is now squarely conducting fiscal policy, and we believe this trend will continue with future policy moves.

The Fed will roll out a Main Street Business Lending Program.

The Fed announced a “Main Street Business Lending Program,” the specifications of which are currently unknown, but we believe it will be of similar structure to the ESF-backed facilities mentioned previously.

These facilities and programs are going to get larger, much larger.

In the CPFF, MMLF, SMCCF, etc., the lending capacity of these vehicles are backed by capital from the U.S. Treasury. For every dollar from the U.S. Treasury, there may be 10 dollars of lending capacity. Of the announced programs, there is roughly $500 billion of lending/market support capacity backed by $50 billion of capital from the ESF. The “Phase 3” stimulus bill upsizes the ESF by $450 billion. Put a 10x multiplier on that and $4.5 trillion is the size of market support and lending capacity that would be available to the Fed. To put this into perspective, the Fed’s balance sheet is currently at $4.6 trillion after over a decade of monetary accommodation since the GFC! A $2 trillion fiscal stimulus program could have the effect of a $6 trillion stimulus program, which is over 30% of U.S. GDP! That would dwarf any stimulus deployed during the GFC by multiples.

The Fed and Treasury are truly doing “whatever it takes.”

We are optimistic that market functioning and liquidity will slowly return. The Fed and Treasury have shown a sense of urgency to support the economy during the COVID-19 pandemic and hopefully, when the virus starts to taper off, we believe we could see a material rebound in financial assets.


Disclosures: This is for informational purposes only and is not intended as investment advice or an offer or solicitation with respect to the purchase or sale of any security, strategy or investment product. Although the statements of fact, information, charts, analysis and data in this report have been obtained from, and are based upon, sources Sage believes to be reliable, we do not guarantee their accuracy, and the underlying information, data, figures and publicly available information has not been verified or audited for accuracy or completeness by Sage. Additionally, we do not represent that the information, data, analysis and charts are accurate or complete, and as such should not be relied upon as such. All results included in this report constitute Sage’s opinions as of the date of this report and are subject to change without notice due to various factors, such as market conditions. Investors should make their own decisions on investment strategies based on their specific investment objectives and financial circumstances. All investments contain risk and may lose value. Past performance is not a guarantee of future results.

Sage Advisory Services, Ltd. Co. is a registered investment adviser that provides investment management services for a variety of institutions and high net worth individuals. For additional information on Sage and its investment management services, please view our web site at www.sageadvisory.com, or refer to our Form ADV, which is available upon request by calling 512.327.5530.

Black Swans of the Same Feather – Sage Commentary on Recent Market Volatility

The market moves in recent weeks have been nothing short of unprecedented. We seem to be experiencing multiple rare and unpredictable events simultaneously. The following is a recap of key events and our observations thus far.

A recap of last week through Monday, March 9:

  • COVID-19 concerns have grown given its spread to an increasing number of countries. The disease has now reached more than half of the countries in the world, including the U.S. This has been a major concern, and markets have priced in a hit to economic growth both from private sector demand and more uniquely, supply-side shock, as supply-chain disruptions in Asia and now the U.S. will result in a further hit to global growth. In its most recent report, the OECD revised its 2020 global growth rate assumption down to 2.4% from an already low 3% given concerns around COVID-19. The rate could fall as low as 1.5%, according to the OECD’s outlook.
  • A strong policy stimulus response was expected, and the Fed made the first move, with an emergency 50 bps rate cut on March 3. However, given that the current situation largely involves an unpredictable viral outbreak that is truly an external shock, lowering the cost of money did not have the same effect as in prior slowdowns since the 2008 crisis. In the coming weeks, the world’s major central banks and governments are expected to inject additional monetary and fiscal stimulus into the economy to combat any potential slowdown. The ECB is expected to ease policy further, either by cutting rates and/or making asset purchases on March 12, and the Fed is expected to follow suit with further rate cuts on March 18. On the fiscal side, affected countries could provide fiscal stimulus to their respective private sectors through the form of tax cuts or direct relief to affected industries – similar to what China has done over the past month for its domestic business sector.
  • In addition to the COVID-19 shock, tensions between Russia and Saudi Arabia have escalated into an all-out oil price war. In response to a breakdown in OPEC/Russia talks last week, on Saturday, Saudi Arabia announced massive discounts to its official oil selling prices and indicated that it was increasing production above the typical 10 million barrels per day. The fear of an oil price war resulted in a 25% selloff in crude oil during yesterday’s trading session – the second worst day for WTI crude on record. The selloff sent shockwaves through global markets, as any commodity-linked asset class or sector priced in an additional hit to growth on top of slowing activity from COVID-19.
  • These events occurred in the context of a market with extremely thin liquidity. Wider bid-ask spreads across all asset classes have amplified market volatility with several extreme +3% up and down days. Currently, the VIX index is trading at 55, the highest at any time since the 2007/2008 crisis.


Observations:

  • The collapse of Treasury yields – Treasury yields have collapsed to all-time lows as investors continue to flock to safe havens. U.S. Treasury markets are not just pricing in further Fed action, they are pricing in a total “Japanification” of the U.S. economy with long-duration yields trading well below 1% at the start of this week.


  • Widening credit spreads – Credit spreads have widened past 4Q 2018 to near 2016 levels, with the speed of the move catching investors off guard. U.S. credit markets, which before March had been resilient against virus fears, have repriced to reflect a significant economic slowdown over the balance of 2020. Currently, the U.S. high yield sector offers an all-in yield at near 8%, which could prove to be an interesting opportunity if market volatility begins to settle down as a result of positive Covid-19 breakthroughs, government policy actions, and increased investor confidence.


  • Equity performance vs. bonds The recent relative return of global equities versus bonds has no precedent outside of the financial crisis, since right after the collapse of Lehman Brothers and AIG. The chart below shows the 1-month relative return of the MSCI ACWI vs. the Bloomberg Global Aggregate Index, which stands at -21%.


The Market is Pricing in a Recession – The Question is: How Deep?

At Sage, we’ve maintained a relatively low level of risk across most of our strategies and remain opportunistic. A full-scale risk-off positioning often provides an opportunity in dislocated areas of the market, but we believe it’s too early to “buy the dip” here. Markets are in “no-man’s land” in some respect, driven by a tremendous amount of uncertainty and fear.

The scenario in which COVID-19 disruption devolves into a global recession is now reflected in market pricing. The question now is how deep is it expected to be? Policymakers will respond in the coming days and weeks with monetary and fiscal stimulus, but the nature of those policies will have to somehow address the threat to the economy that is now fourfold: COVID-19 demand/supply chain shock, an oil price war, credit stress, and a lack of trading liquidity. We await that response, along with any new details, and will continue to keep you updated as this unprecedented situation develops.


Going Forward: Heightened Market Surveillance & Identifying Value Across Asset Classes

  • The Sage investment team is deeply experienced and has worked together through multiple cycles, including several periods of economic and market stress. During uncertain times, the structure and experience of our team has proven to be an advantage for our clients.
  • We approach this environment with patience and diligence. Within our fixed income portfolios, our duration positioning has become more defensive in anticipation of more normalized levels of interest rates. Furthermore, a normalization of market risk has the potential to steepen the yield curve in concert with further rate cuts from the Fed. Within credit, we have maintained a relatively conservative posture, which has helped to mitigate downside risk during this correction. We continue to be selective in our credit exposure, avoiding issuers that we deem to be vulnerable to near-term downgrade pressures. In early February, we lowered equity sensitivities within our multi-asset class strategies, which allows us to be opportunistic in the case that conditions improve and/or attractive valuations present themselves.
  • For more information about specific Sage strategies, please reach out to your client service team at 512-327-5530.


* Source on all charts is Bloomberg.


Disclosures: This is for informational purposes only and is not intended as investment advice or an offer or solicitation with respect to the purchase or sale of any security, strategy or investment product. Although the statements of fact, information, charts, analysis and data in this report have been obtained from, and are based upon, sources Sage believes to be reliable, we do not guarantee their accuracy, and the underlying information, data, figures and publicly available information has not been verified or audited for accuracy or completeness by Sage. Additionally, we do not represent that the information, data, analysis and charts are accurate or complete, and as such should not be relied upon as such. All results included in this report constitute Sage’s opinions as of the date of this report and are subject to change without notice due to various factors, such as market conditions. Investors should make their own decisions on investment strategies based on their specific investment objectives and financial circumstances. All investments contain risk and may lose value. Past performance is not a guarantee of future results.

Sage Advisory Services, Ltd. Co. is a registered investment adviser that provides investment management services for a variety of institutions and high net worth individuals. For additional information on Sage and its investment management services, please view our web site at www.sageadvisory.com, or refer to our Form ADV, which is available upon request by calling 512.327.5530.

All Hands on Deck – An Update on COVID-19, Its Effect on Markets, and Our Game Plan

It’s been a long week for the markets. After a respite at the beginning of February, fears around the coronavirus (COVID-19) have devolved into a full-blown panic, resulting in the fastest equity selloff ever. Looking across markets reveals the extent of the turmoil:

A few observations from the last eight trading days:

  • U.S. risk assets are leading the down move. The S&P 500 fell into a corrective -10% drawdown in the shortest time period ever. In addition, investment grade corporate credit spreads, which were largely immune to the initial COVID-19 shock in January, widened by 23 basis points to 1.20% over Treasuries. High yield corporate spreads have widened by 112 bps to nearly 5% over Treasuries.
  • Conversely, Chinese equities have outperformed handily during the recent drawdown. Whether it reflects improving conditions in China, or an under-owned region outperforming in a “sell-everything” market, de-risking remains to be seen.
  • Treasury rates continue to make new all-time lows. As of this writing, the U.S. 10Y yield is hovering near 1.15% which is well through the low in yield established during the Brexit Referendum in 2016.

It’s all hands on deck for us at Sage. While we don’t know yet what medium to long-term effects the COVID-19 will have on markets, we do see some areas that could present an opportunity given the extreme fear in the market. Here’s our perspective on various asset classes and the game plan for investing in this environment.

Fixed Income: Interest Rates to Remain Low:

Treasury yields have retreated to make a new all-time low, reflecting COVID-19’s potential impact on the global economy. In January, market consensus treated the effects of the virus as having no more than a 1Q effect on GDP. As the virus continues to spread to more countries, the market has shifted to discounting a much deeper hit to the global economy.

The markets are expecting the Fed to act in response to the virus shock – the Fed Funds market is now anticipating nearly four rate cuts this year (Chart 1) after pricing in just one on February 20th. The Fed’s projection of its rate path, which hasn’t been updated since December, now looks far different than market pricing. Market participants will certainly pay close attention to future Fed communications.

Given the uncertainty in the market, continued flows into high quality fixed income, and potential policy easing, we expect yields to remain low, or even move lower from here. We are maintaining a longer duration across our fixed income strategies.

Credit spreads have widened in kind with the equity selloff, albeit its move isn’t as extreme when compared to recent history. The corporate bond markets are still adjusting to the risk to global growth from historically low spread levels (Chart 2). Conversely, at ultra-low Treasuries yields, corporate credit and other spread sectors now present an interesting yield advantage versus low Treasury yields. To that end, we are carrying a relatively low level of corporate credit risk across most strategies, leaving room to add to credit in the case that the narrative on COVID-19 changes for the better and/or take advantage of dislocations that occur during a panic sell-off.

Equities/Multi-Asset Strategies:

Ahead of the most recent selloff, we lowered equity exposure within the Multi-Asset Income strategies, and reduced beta in our equity allocations. Equity price action during the end of February reflected the public fear around the spread of the COVID-19. The S&P 500 rallied to an all-time high on February 20 then subsequently fell into a corrective 10% drawdown one week later – the fastest descent into a correction, ever. The magnitude of the down move was exacerbated by selling pressure from systematic strategies and retail investors. Two widely followed technical indicators – Relative Strength Index (Chart 3) and Put/Call Ratio (Chart 4) – are at extreme bearish levels which tells us that selling pressure should subside in the near term.

Going Forward: Heightened Market Surveillance & Identifying Value Across Asset Classes

So what now? While we think equity and credit selling pressure should subside in the near-term, uncertainty around the effect of the COVID-19 will remain, along with corresponding market volatility. However, a market environment driven by fear, speculation, and uncertainty could present opportunities to identify mispriced securities, sectors, or asset classes as more information comes to light. We approach this environment with patience and diligence. Within our fixed income portfolios, we remain slightly long duration and carry a relatively low level of credit risk. Within our multi-asset class strategies, we’ve recently lowered equity sensitivities, which allows us to be opportunistic in the case that conditions improve and/or attractive valuations present themselves.

We are closely monitoring the COVID-19 situation and will continue to update you on any changes in market conditions or our perspective.


Disclosures: This is for informational purposes only and is not intended as investment advice or an offer or solicitation with respect to the purchase or sale of any security, strategy or investment product. Although the statements of fact, information, charts, analysis and data in this report have been obtained from, and are based upon, sources Sage believes to be reliable, we do not guarantee their accuracy, and the underlying information, data, figures and publicly available information has not been verified or audited for accuracy or completeness by Sage. Additionally, we do not represent that the information, data, analysis and charts are accurate or complete, and as such should not be relied upon as such. All results included in this report constitute Sage’s opinions as of the date of this report and are subject to change without notice due to various factors, such as market conditions. Investors should make their own decisions on investment strategies based on their specific investment objectives and financial circumstances. All investments contain risk and may lose value. Past performance is not a guarantee of future results.

Sage Advisory Services, Ltd. Co. is a registered investment adviser that provides investment management services for a variety of institutions and high net worth individuals. For additional information on Sage and its investment management services, please view our web site at www.sageadvisory.com, or refer to our Form ADV, which is available upon request by calling 512.327.5530.

Watch for These 6 ESG Trends in 2020

by the Sage ESG Team

1. A greater adoption of ESG.

Growth in ESG funds continues to climb. According to Morningstar, net flows to sustainable funds in the U.S. were $20.6 billion in 2019, almost four times the amount of net flows from 2018 of $5.5 billion. There are now 300 ESG open-ended funds and ETFs, up 27% YOY from 236 funds in 2018.

Source: MorningStar Direct, Data as of 12/31/2019


2. Greater results.

Gone are the days of sacrificing performance to invest in the causes and themes we care about. More people are investing in ESG portfolios because the performance of ESG strategies are competitive with conventional investment products and align to individuals’ values. We call it a double-bottom line. This month, Barron’s reported that in 2019 big-cap equity mutual funds that received a Morningstar sustainability rating of “above average” or “high” outperformed comparable funds with lower sustainability ratings.

Source: Barron’s Morningstar

We are seeing similar results. In 2019, Sage fixed income and equity ESG strategies also outperformed their respective market benchmarks.


3. An increase in products.

We are seeing new ESG products emerge across the asset allocation spectrum, from 401(k) plans to real estate and alternatives portfolios. Specialty funds on ESG themes have also risen in popularity, such as strategies with increased focus on diversity, with gender emphasis, and a breakout of climate change issues, including fossil-fuel-free funds.

Source: RBC Global Asset Management

At Sage, we expect an increase in the number and types of our product offerings in 2020. Last year, Sage ESG portfolios made their way into cash management and 401(k) plans, providing ESG investment opportunities to plans where there is growing demand but few ESG options.


4. Increased competition.

As more ESG products make their debut, we expect 2020 will be a year of separation in the quality of performance and ESG integration process. There will be heightened scrutiny from SEC, as ESG consideration is increasingly viewed as part of an investor’s fiduciary duty to clients, and institutional consultants will become clearer on their ESG investment requirements. It will be important for each asset manager and each ETF provider to have clear processes in place for how they choose ESG investments. Investors will want to know 1) What is the framework? 2) What is the source of the data? 3) How does it reflect the culture of the firm? 4) what is the client reporting process? 5) how has the strategy performed? Third-party validation from data providers, such as MSCI and Sustainalytics, will matter; the industry will need a referee to say what is truly ESG.

Sage ESG has portfolios that are audited by Sustainalytics semi-annually, because we believe it’s important to our clients to have third-party verification. We also conduct annual stewardship surveys to engage with ETF providers and determine which have practices and policies in place to select the best ESG companies to include in an ETF.


5. Internal ESG policies will matter.

When it comes to choosing an ESG investment manager, internal policies and the “ESG-ness” of the firm will be just as important as its ESG investment holdings. Increasingly, public companies and ESG investment managers are producing annual sustainability reports to measure how their product, services, and people adhere to ESG standards.

In 2018, 86% of the companies in the S&P500 Index published sustainability or corporate responsibility reports.

Source: Governance & Accountability Institute, Inc. 2018 Research – www.ga-institute.com

Additionally, it will be increasingly important for ESG investment managers to affiliate with and support ESG research and reporting organizations, such as MSCI, Sustainalytics, and the Sustainability Accounting Standards Board (SASB), and to seek and hold key certifications, such as the B Corporation designation.

Sage is a member or supporter of all the sustainable organizations that we believe are making the strongest advances in ESG research and reporting. These include Principles for Responsible Investing (PRI), Climate Action 100, The Forum for Sustainable and Responsible Investment (US SIF), Task Force on Climate-Related Financial Disclosures (TCFD), the Sustainability Accounting Standards Board (SASB), and The Green Bond Principles. We also produce and update annually our Sage Responsible Investment Policy in order to provide investors with transparency about how we incorporate ESG factors into our investment process.


6. Clearer reporting.

An emphasis on clear, concise, and consistent reporting will be higher than ever. An increase in the number and types of products will cause confusion in two dimensions: 1) What third-party sources should I pay attention to, and 2) Who is (actually) doing ESG and how do they do it?

At Sage, we are pragmatic in our ESG investing. Our client reporting includes consistent communication about measurable outcomes. For us, financial materiality and the “G” in ESG will be the focus. Governance will be followed by an emphasis on social and environmental factors, because we believe change starts within the company. This year we will introduce more broadly our Sage ESG Leaf Score, enabling investors to quickly assess ESG performance across companies and industries.

Disclosures: This is for informational purposes only and is not intended as investment advice or an offer or solicitation with respect to the purchase or sale of any security, strategy or investment product. Although the statements of fact, information, charts, analysis and data in this report have been obtained from, and are based upon, sources Sage believes to be reliable, we do not guarantee their accuracy, and the underlying information, data, figures and publicly available information has not been verified or audited for accuracy or completeness by Sage. Additionally, we do not represent that the information, data, analysis and charts are accurate or complete, and as such should not be relied upon as such. All results included in this report constitute Sage’s opinions as of the date of this report and are subject to change without notice due to various factors, such as market conditions. Investors should make their own decisions on investment strategies based on their specific investment objectives and financial circumstances. All investments contain risk and may lose value. Past performance is not a guarantee of future results.

Sage Advisory Services, Ltd. Co. is a registered investment adviser that provides investment management services for a variety of institutions and high net worth individuals. For additional information on Sage and its investment management services, please view our web site at www.sageadvisory.com, or refer to our Form ADV, which is available upon request by calling 512.327.5530.