Notes from the Desk: Is Corporate Leverage Offering a Warning Sign?

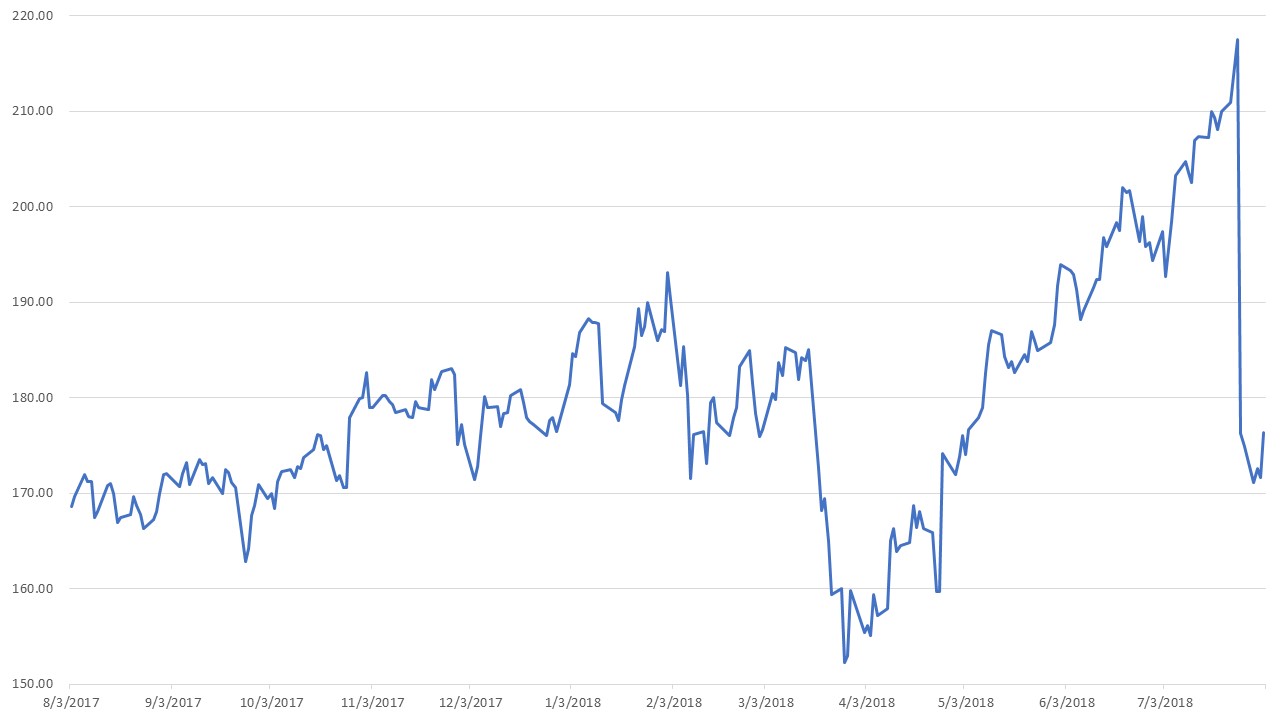
Non-Financial Corporate Leverage is Increasing

As several market observers have written, corporate leverage continues to increase. Specifically, leverage, or the ratio of a company’s debt to cash flow, has increased noticeably among non-financial corporate bond issuers since 2010. Investment Grade issuers in this cohort have increased their Debt/EBITDA ratios from 2x to nearly 3x in this time frame, according to data from the St. Louis Federal Reserve (see below).


Source: St. Louis Federal Reserve


The reasons for this increase in corporate debt are manifold.

Some companies have increased their borrowings in order to accelerate stock buyback programs. Stock buybacks have become increasingly popular with corporate management teams as a way to manage earnings per share and appease activist equity holders, particularly at companies with tepid revenue growth.

Other companies have used the proceeds from large debt issuances to engage in M&A activity, often for the same purpose of ginning up top-line growth.

Regardless of the ultimate use of funds, the simplest reason why corporations have increased borrowing is also the most likely: because they can. Companies are more comfortable than ever with higher leverage and lower credit ratings because the market has not yet punished them for it. Over decade ago, only 25% of investment grade issuers carried a credit rating below “A.” Now, nearly 50% of the Bloomberg Barclay’s Corporate index is rated “BBB.” In addition, the extra spread demanded by investors for investing in BBB-rated credit vs. A-rated credit has hovered in the 40-to-70 basis point range for most of the time period following the 2008-2009 financial crisis. Many CFOs figure that paying an additional 0.50% of coupon yield for lower ratings and another turn or two of leverage is worth the gamble — if it allows them keep equity prices high, since equity returns are often correlated with management compensation.


Source: Barclay’s Capital


Strong Equity Performance Has Helped

This conflict of interest between management teams and bondholders also drives another self-fulfilling prophecy: borrowing money to help improve equity returns at the expense of credit quality leads to higher equity returns, which leads to more complacency amongst bondholders.  Bondholders often look at “equity cushion” as a mitigating factor against increased leverage. They reason that if equity investors are willing to pour money into the capital structure at a level junior in priority to unsecured bondholders, then bondholders should feel relatively more comfortable with the risk of lending to the entity. The strong equity market returns of the past nine years has made the increase in leverage seem less significant to the capital structures of most companies than it actually has been.


Source: St. Louis Federal Reserve


Some Industries Have Bucked the Trend

The Banking sector is a good example of an industry that has not followed this trend of increasing leverage. After the last financial crisis, banks were forced to adopt capital buffer requirements, which have effectively lowered leverage, while the rest of the corporate bond universe has been going in the opposite direction.

A bank’s tier 1 risk-based capital ratio is a measure of liquidity and financial health. Tier 1 capital is a bank’s equity capital and core reserves. The ratio is calculated by dividing tier 1 capital by total risk-weighted assets. While major banks are required by Basel III regulations to hold a ratio of 6% or greater, on average most large banks have ratios in the 13% range, more than double what is required by law.


Source: Bloomberg


The energy and REIT sectors have also been de-leveraging in recent quarters. REITs have been decreasing leveraging due to lower returns in the real estate industry and in anticipation of bargains in the near future.

Energy companies have benefitted from an improving price environment for oil and natural gas, as well as increased operational efficiency, which has allowed them to use free cash flow to pay down debt organically.


What Should Investors Do?

As the end of the current bullish business cycle appears to be near, bondholders should proceed with caution. The recent sell-off in risk assets has presented some opportunities and exposed risks in the corporate bond market.

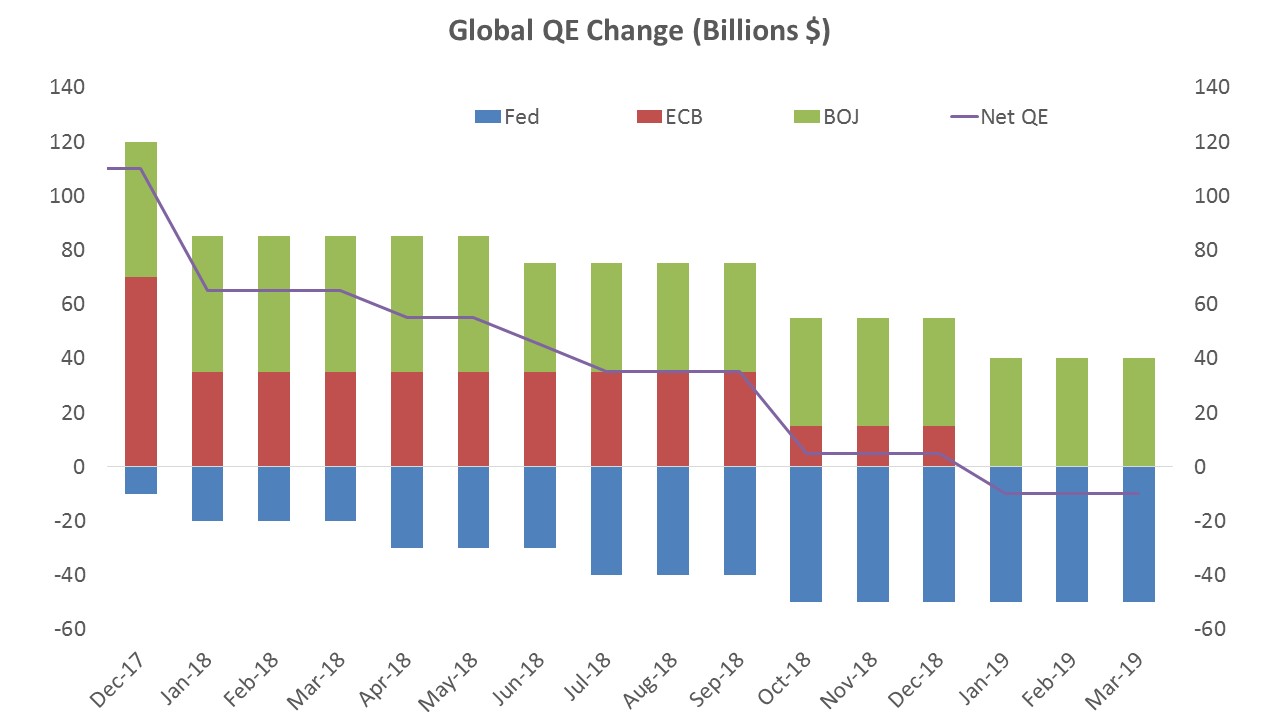
At Sage, we believe that now is the time to “sharpen the pencil” and go to work analyzing credits more closely, as dispersion in returns is likely to increase dramatically. As the large global Quantitative Easing program being orchestrated by Central Banks begins to wind down, companies that have weak financial fundamentals will see increased scrutiny from analysts and in some cases, will have trouble accessing capital markets to refinance debt. Given this possible outcome, we’ve developed a credit playbook for selecting the winners from the losers:

  1. Look for companies that have avoided the urge to lever up in order to engage in shareholder-friendly activities, such as stock buybacks, dividends, and frivolous M&A.
  2. Look for companies that have the capacity to service their own debt organically through stable or growing free cash flow.
  3. Avoid companies with complicated corporate structures or that have engaged in dubious M&A activity to mask declining top-line revenues at the expense of bondholders.
  4. Look for opportunities within sectors where fundamentals are still intact, leverage is lower, and liquidity is strong.


Disclosures: This is for informational purposes only and is not intended as investment advice or an offer or solicitation with respect to the purchase or sale of any security, strategy or investment product. Although the statements of fact, information, charts, analysis and data in this report have been obtained from, and are based upon, sources Sage believes to be reliable, we do not guarantee their accuracy, and the underlying information, data, figures and publicly available information has not been verified or audited for accuracy or completeness by Sage. Additionally, we do not represent that the information, data, analysis and charts are accurate or complete, and as such should not be relied upon as such. All results included in this report constitute Sage’s opinions as of the date of this report and are subject to change without notice due to various factors, such as market conditions. Investors should make their own decisions on investment strategies based on their specific investment objectives and financial circumstances. All investments contain risk and may lose value. Past performance is not a guarantee of future results.

Sage Advisory Services, Ltd. Co. is a registered investment adviser that provides investment management services for a variety of institutions and high net worth individuals. For additional information on Sage and its investment management services, please view our web site at www.sageadvisory.com, or refer to our Form ADV, which is available upon request by calling 512.327.5530.

Recent Market Volatility

In another sign that markets continue to move into a late-cycle, higher-volatility regime, equity markets fell significantly yesterday. U.S. equities registered a 3% to 4% loss led by high-momentum technology names, yet other asset classes, such as bonds, did not react in an outsized way. High-yield spreads widened by 9 basis points and investment grade corporate spreads ticked higher by 1 basis point, well within normal levels. Given the sharp and isolated nature of the equity sell-off, we think that this move is reflective of a positioning-led capitulation and equity prices should stabilize.

Sharply higher rates and growing trade concerns have given way to capitulation in equities. Given the strong macro backdrop, we also do not think this is the “big one.” Underlying growth conditions still point to a low probability of a recession. The U.S. economy is projected to grow at an above 4% pace in 3Q, and the world’s major economies remain in a modest economic expansion. The worst performers during this drawdown have been the high-momentum and growth market segments, areas of the market that have seen a massive uptake in long positioning in recent years. The downward move is being exacerbated by the fact that the U.S. equity market is currently in a buyback blackout period similar to the February episode. U.S. companies typically have a five-week “quiet period,” which limits companies’ ability to buy back stock. We estimate that 90% of the U.S. equity market is under the blackout, and as the calendar moves closer to earnings season in November, this source of demand will come back to support equities. Markets have swung to oversold territory over just a couple days, and in the past, this has consistently led to positive gains over the following month.

Other factors point to an isolated correction vs. a broad reversal. High-beta markets, such as small caps and emerging markets outperformed U.S. large-cap equities, which suggests this is not a broad-based risk-off scenario and is likely to continue. Additionally, credit markets have not corroborated equity sentiment, with high yield and investment grade stable throughout recent equity market volatility.

The sharp rate move from August yield levels has been driven by the strong U.S. growth outlook, a more hawkish Fed, and the initiation of tapering in the Eurozone. We still hold our year-end yield range on the 10yr of 3.00%-3.25% for the following reasons:

1) This recent move has not been driven by higher inflation (YOY core CPI has dropped in the last two releases), which we believe would have to happen to see a sustained higher-yield environment.

2) Given the Fed’s terminal rate of around 3%, still muted inflation, and the market pricing in four additional rate hikes, we don’t see a meaningful rate move higher.

While markets are likely to remain volatile given higher rates, trade tensions, and other macro concerns, we do not see recent market action as a signal to a broader change in the current cycle. We still believe the keys for fixed income allocations going forward will be active duration and curve management, along with a heightened emphasis on issuer selection and relative value within credit allocations. For equity allocations, we added international exposure toward the end of the third quarter, based on overdone negative sentiment, improving data for non-U.S. regions, and attractive valuations. We also tactically moved back to an overweight position in EM equities, based on significant underperformance and a more supportive policy stimulus outlook from China. Despite the recent increase in yields, we still see limited risk of a real hawkish surprise from the Fed. And with the increased policy support from China, we believe this sets the table for upside in EM markets. That said, we have kept our overweight in the region small and resisted adding to it as the stabilization in sentiment has been slow.

There are a few risks to our view that warrant caution. First, the ECB’s balance sheet tapering began this month; we will be watching whether financial condition tightening in the Eurozone spills over to global markets in a significant way. Second, China’s response to escalating trade tensions have been to bolster its economy with both monetary and fiscal stimulus programs. To the extent that that continues, we believe investor confidence should return to EM, but there is still some uncertainty as to how China will conduct its economic policies. Lastly, the U.S. earnings season begins in November with expectations for continued high earnings growth. A downside surprise to earnings could shake investor confidence in the U.S. economic expansion. These scenarios are not our base case, but they could present a risk to our baseline views.

Disclosures: This is for informational purposes only and is not intended as investment advice or an offer or solicitation with respect to the purchase or sale of any security, strategy or investment product. Although the statements of fact, information, charts, analysis and data in this report have been obtained from, and are based upon, sources Sage believes to be reliable, we do not guarantee their accuracy, and the underlying information, data, figures and publicly available information has not been verified or audited for accuracy or completeness by Sage. Additionally, we do not represent that the information, data, analysis and charts are accurate or complete, and as such should not be relied upon as such. All results included in this report constitute Sage’s opinions as of the date of this report and are subject to change without notice due to various factors, such as market conditions. Investors should make their own decisions on investment strategies based on their specific investment objectives and financial circumstances. All investments contain risk and may lose value. Past performance is not a guarantee of future results.

Sage Advisory Services, Ltd. Co. is a registered investment adviser that provides investment management services for a variety of institutions and high net worth individuals. For additional information on Sage and its investment management services, please view our web site at www.sageadvisory.com, or refer to our Form ADV, which is available upon request by calling 512.327.5530.

A Better Balance of Risk: ESG Investing for Insurance Companies

Insurance has always been a balance of risk – a balance of pure insurance risk (or underwriting risk) versus investment risk. The balance that is ultimately struck determines the unique personality of each insurance company. What is common among these disparate personalities is a desire to achieve specified results with the least amount of risk possible. From the investment side of the equation, this means protecting the growth of capital and surplus while maximizing risk-adjusted returns. Cue ESG!

At Sage, we view the incorporation of ESG principles as a logical and effective means of risk mitigation for insurance company portfolios, one that is a natural extension of the insurance experience. This experience refers to Enterprise Risk Management (ERM), an essential part of an insurance company’s ongoing operations. ESG applications serve to reveal risks that were once embedded in the investment portfolio, resulting in a more robust ERM framework. We now have further affirmation of this view. Survey trends continue to suggest a growing interest in and incorporation of ESG considerations into the investment process as a means for further enhancing risk mitigation efforts while at the same time not sacrificing returns.

A recent FundFire article surveyed the 2018 Global Insurance Report by BlackRock, which has over $7.8 trillion in assets under management. The findings in the report indicate that environmental, social, and governance issues are very significant to the insurance industry globally. That report states that:

  • 83% of insurers suggest having an ESG policy is either extremely important or very important
  • 59% of North American insurers have already adopted an ESG investment policy
  • 70% of insurers lack ESG internal modeling capabilities

Through our own engagement with clients and the insurance industry at large, we are now seeing more frequent inquiries into how to better incorporate specific values, advocacies, or concerns that reflect the unique personality of the insurance company in question.

Given our ESG modeling capabilities and experience, potential solutions range from a separate ESG mandate; to a partial ESG “overlay” onto the general account; to a more holistic approach with a full integration of ESG principles into the investment process. At all three levels, Sage is able to effectively deliver an ESG solution.

We invite you to contact us for a deeper discussion or to even submit a portfolio for review to determine an effective implementation of ESG principles. You can also view our website for a thorough understanding of our insurance-specific capabilities and ESG-specific solutions – and how the marriage of the two can deliver a superior risk-managed approach to investing for insurance companies.

Disclosures: This is for informational purposes only and is not intended as investment advice or an offer or solicitation with respect to the purchase or sale of any security, strategy or investment product. Although the statements of fact, information, charts, analysis and data in this report have been obtained from, and are based upon, sources Sage believes to be reliable, we do not guarantee their accuracy, and the underlying information, data, figures and publicly available information has not been verified or audited for accuracy or completeness by Sage. Additionally, we do not represent that the information, data, analysis and charts are accurate or complete, and as such should not be relied upon as such. All results included in this report constitute Sage’s opinions as of the date of this report and are subject to change without notice due to various factors, such as market conditions. Investors should make their own decisions on investment strategies based on their specific investment objectives and financial circumstances. All investments contain risk and may lose value. Past performance is not a guarantee of future results.

Sage Advisory Services, Ltd. Co. is a registered investment adviser that provides investment management services for a variety of institutions and high net worth individuals. For additional information on Sage and its investment management services, please view our web site at www.sageadvisory.com, or refer to our Form ADV, which is available upon request by calling 512.327.5530.

Facebook’s Fall: Why Considering ESG is Important in the Investing Process

Long before Facebook revealed that 87 million users’ data may have been breached (April 2018), and even before it was revealed that Ted Cruz’s presidential campaign retrieved Facebook users’ data without their permission (December 2015), Facebook had a Sustainalytics Controversy Score of 3 (on a 1-5 scale) because of data privacy issues. While Facebook’s stock has had some jolts and recoveries, which is typical in the days surrounding company “incidents,” it was, until very recently, up by triple digits since mid-2014. Until the stock fell 19% last week, it might have been difficult to make a case against investing in Facebook given the stock’s ascent. To be sure, those who made bets against Facebook have seen a pay-off.

Facebook’s Stock Price


Source: Yahoo Finance


For as long as it’s been controversial, the company has been screened out of Sage’s Environmental, Social, and Governance (ESG) security selection process because of its controversy score alone; we don’t invest in companies with a controversy score higher than 3 (Facebook’s current Controversy Score is 4). The consideration of Controversy Scores is just one factor Sage considers when analyzing securities through our ESG Framework. We also analyze each E, S, and G factor, as well as impact and impact intensity. We believe companies that have high standards for ESG – in Facebook’s case, there’s a lack of Social integrity – build sustainable business models and create sound investment opportunities. That being said, Facebook could be an opportunity worth looking at if it’s valuation becomes attractive, and it has a positive controversy outlook. As of now, it has neither.


Sage ESG Investment Approach


Source: Sage Advisory


Facebook Controversy Outlook

Source: Sustainalytics


Disclosures: This is for informational purposes only and is not intended as investment advice or an offer or solicitation with respect to the purchase or sale of any security, strategy or investment product.  Although the statements of fact, information, charts, analysis and data in this report have been obtained from, and are based upon, sources Sage believes to be reliable, we do not guarantee their accuracy, and the underlying information, data, figures and publicly available information has not been verified or audited for accuracy or completeness by Sage.  Additionally, we do not represent that the information, data, analysis and charts are accurate or complete, and as such should not be relied upon as such.  All results included in this report constitute Sage’s opinions as of the date of this report and are subject to change without notice due to various factors, such as market conditions.  Investors should make their own decisions on investment strategies based on their specific investment objectives and financial circumstances.  All investments contain risk and may lose value.  Past performance is not a guarantee of future results.

Sage Advisory Services, Ltd. Co. is a registered investment adviser that provides investment management services for a variety of institutions and high net worth individuals.  For additional information on Sage and its investment management services, please view our web site at www.sageadvisory.com, or refer to our Form ADV, which is available upon request by calling 512.327.5530.

3 Questions for the Second Half

What follows the volatile market environment we saw in the first half of 2018?

If the volatility during the first half of 2018 was caused by fears of reflation and higher rates negatively impacting equities, then the theme unfolding for the second half is looking like the opposite – a shock to growth due to trade issues or a slowdown abroad. In the first half, synchronous global growth gave way to U.S. growth leadership. After coming into the year with high expectations for private sector growth and corporate earnings, the U.S. economy has met or surpassed expectations while economies abroad have struggled to keep pace. European economic growth has not met the ECB’s expectations, and with inflation anchored in the region, the European Central Bank has responded by delaying any rate hikes until late 2019. Emerging market economies, while much stronger than they were in 2013, have shown vulnerability to tighter financial conditions caused by tighter Fed policy, rising short-term rates, and a stronger U.S. Dollar. These negative shocks have been exacerbated by political issues, such as those in Latin America, or trade issues in China. The big question in the second half will be the market’s reaction to continued shrinking of central bank balance sheets. By our estimation, aggregate QE purchases by the Fed, the European Central Bank, and the Bank of Japan will turn negative going into 2019. Will the volatility suppression dynamic of central bank purchases reverse along with the end of QE?

Source: Sage, Bloomberg

Is a trade war going to hinder growth?

As we’ve written in the past, a trade war caused by increasing tariffs raises prices for the private sector and acts as a tax on the economy, thereby lowering growth in the process.  World trade activity has been decreasing since the global financial crisis; while this is not the first episode of restrictive trade policies in recent years, what makes the current episode significant is how it is occurring: between the world’s two largest economies on the most public stage — news headlines. While the tariffs don’t promote economic growth, they aren’t enough to turn the current economic expansion into a retraction. Our main concern are the indirect effects of tariffs – there could be a second order of effects in the form of negative “animal spirits” in the financial markets or an escalation that moves beyond trade.

Is it time to get defensive?

While we are in the late stages of the current economic expansion, we don’t yet think a recession is imminent. Real interest rates remain at historically low levels relative to economic growth, which we believe provides a solid foundation for economic activity to withstand any trade-driven shocks. However, we do think it’s important to remain diversified across stocks and high-quality fixed income. With the end of QE, the period of a low-volatility bull market is over. Higher-quality bonds should serve as shock absorbers in times of stress. Within fixed income, we favor mitigating risk by allocating to shorter-maturity corporate bonds (CSJ, FLOT), as well as agency MBS (MBB), as they provide a better risk-return profile when compared to longer-maturity spread sectors.

On the equity side, we see the U.S. economy continuing to lead in the second half, which should result in the continuation of U.S. equity outperformance versus international equities. Specifically, U.S. mid- and small-cap equities have done well, and we believe they will continue to do so. Cyclically-oriented segments of the market, such as tech (XLK), energy (XLE), and consumer discretionary (XLY), should continue to outperform. One segment to underweight is emerging markets, which continues to be plagued by political concerns, a strong dollar, and tightening global monetary policy.

Disclosures: This is for informational purposes only and is not intended as investment advice or an offer or solicitation with respect to the purchase or sale of any security, strategy or investment product.  Although the statements of fact, information, charts, analysis and data in this report have been obtained from, and are based upon, sources Sage believes to be reliable, we do not guarantee their accuracy, and the underlying information, data, figures and publicly available information has not been verified or audited for accuracy or completeness by Sage.  Additionally, we do not represent that the information, data, analysis and charts are accurate or complete, and as such should not be relied upon as such.  All results included in this report constitute Sage’s opinions as of the date of this report and are subject to change without notice due to various factors, such as market conditions.  Investors should make their own decisions on investment strategies based on their specific investment objectives and financial circumstances.  All investments contain risk and may lose value.  Past performance is not a guarantee of future results.

Sage Advisory Services, Ltd. Co. is a registered investment adviser that provides investment management services for a variety of institutions and high net worth individuals.  For additional information on Sage and its investment management services, please view our web site at www.sageadvisory.com, or refer to our Form ADV, which is available upon request by calling 512.327.5530.


How to Invest with an Economy at Full Capacity

According to the most recent jobs report, unemployment is the lowest it’s been in 18 years. At 3.8%, the unemployment rate is significantly lower than the Fed’s long-run projection of 4.4%. All signs point to an economy running at full capacity. But what does that really mean for investors?

Imagine running a wildly successful widget factory. Your customer base can’t get enough of your widgets – they’re sold out everywhere. Your factory is operating at full tilt, and you’re having to pay employees overtime to meet your production targets. While widget production increases, the factory is not running as efficiently – your employees are overworked, and the wear and tear on your equipment is higher than normal. Your factory is running above its production capacity or potential output.

Like the factory, an economy’s potential growth is also commonly used to refer to an economy’s productive capacity. Potential growth is measured by the amount of goods and services the economy can produce (known as GDP) while operating at its most efficient capacity. What complicates potential growth are fluctuating periods of higher and lower growth, commonly known as the business cycle. To measure whether there’s too much, too little, or just enough growth, it’s important to know how close these growth fluctuations are to the economy’s potential growth.

What is the economy capable of producing and what is it actually producing?

The output gap is the difference between what an economy is producing and what it’s capable of producing. A positive output gap means the economy is growing above its potential growth rate; typically, demand is high and companies are forced to operate far above what is most efficient. A negative output gap signifies the opposite – demand is weak so companies operate with spare capacity. In a perfect world, economic growth equals the potential growth rate, but the cyclical nature of a market economy doesn’t allow that, which necessitates mechanisms such as a central bank to dampen output gaps throughout a business cycle.

Two things drive the potential growth of an economy – 1) the labor force, and 2) the productivity level of that labor. Since productivity moves at a glacial pace, the labor market is more important to economists on a day-to-day basis. Full employment is synonymous with an economy operating at full capacity.

How does capacity affect inflation?

When an economy is operating at capacity, there is no pressure on prices one way or another. A negative output gap results in lower prices, or disinflation; while a positive gap should result in inflation, as prices rise to reflect increased demand relative to tighter supply.

This theory and background are important because after years of operating with a negative output gap, the U.S. economy is increasingly showing signs of full capacity, as evidenced by May’s employment data. The numbers reflected the continued tightening of the labor market in the U.S. as the unemployment rate ticked lower to 3.8%. Compare that figure to the Fed’s projection of long-run unemployment at 4.4%, and the U.S. is squarely operating above capacity.

What does it mean for investors?

The game changes for investors during a backdrop of an economy at full capacity. Most importantly, with an economy at full employment, central bank policy transforms from one that aims to generate economic activity to one that attempts to slow economic activity due to a positive output gap. In the U.S., this takes the form of a higher Federal Funds Rate and a shrinking of the Fed balance sheet.  Without the Fed in play, investors can expect a period of higher market volatility. Relative value between regions, sectors, styles, and individual securities rise in importance as the global equity markets’ beta is less likely to provide favorable risk-adjusted returns as it had during the previous few years. Also, a tight labor market and peaking demand should result in inflation. For investors, this means a focus on commodities and inflation-linked asset classes, such as energy sector equities and bonds, as well as TIPS.

Disclosures: This is for informational purposes only and is not intended as investment advice or an offer or solicitation with respect to the purchase or sale of any security, strategy or investment product.  Although the statements of fact, information, charts, analysis and data in this report have been obtained from, and are based upon, sources Sage believes to be reliable, we do not guarantee their accuracy, and the underlying information, data, figures and publicly available information has not been verified or audited for accuracy or completeness by Sage.  Additionally, we do not represent that the information, data, analysis and charts are accurate or complete, and as such should not be relied upon as such.  All results included in this report constitute Sage’s opinions as of the date of this report and are subject to change without notice due to various factors, such as market conditions.  Investors should make their own decisions on investment strategies based on their specific investment objectives and financial circumstances.  All investments contain risk and may lose value.  Past performance is not a guarantee of future results.

Sage Advisory Services, Ltd. Co. is a registered investment adviser that provides investment management services for a variety of institutions and high net worth individuals.  For additional information on Sage and its investment management services, please view our web site at www.sageadvisory.com, or refer to our Form ADV, which is available upon request by calling 512.327.5530.

Notes from the Desk: A Perfect Storm in the Bond Market

A perfect storm in the bond market just occurred as Hurricane Fed crossed paths with an Italian tropical storm and U.S. Dollar high pressure system. After hitting a high of 3.12% on 05/21/18, 10-year Treasury yields have fallen 25bps, touching a low of 2.76% yesterday. What’s driving this move? It’s a confluence of curve slope, U.S. Dollar strength, and Italian political strife. With this mix of factors, the Fed may find a neutral policy rate sooner than expected. Any reprieve from rate hikes would deliver much-needed rate stability and offer bond investors some upside for the balance of 2018.

The slope of the Treasury yield curve, or the difference between short and long rates, has been on the decline since the Fed began its current rate hike cycle. With the difference between 2-year and 10-year Treasuries at 45bps, the Fed is in danger of inverting the yield curve with three more hikes this year. In the past, inverted yield curves have preceded economic slowdowns. Rate hikes concurrent with balance sheet reduction could mean the Fed’s total policy mix moves past normalized and right into restrictive territory.  Numerous Fed presidents, including Kaplan, Bostic, and Bullard have offered hesitation over inverting the yield curve. Without a pickup in long-term yields, September and December rate hikes become questionable.

Another factor at play recently is the U.S. Dollar, which has rallied 6% since April. Strength in the U.S. Dollar creates headwinds for improved inflation. Dollar strength has also caused some consternation for international equity investors, with emerging markets (EM) down 5.9% since the dollar began its rally in April. Policy hikes supporting additional dollar strength puts the Fed at risk of amplifying downward pressure on U.S. inflation, raising the local currency cost of U.S. Dollar-denominated EM debt, and increasing concerns of a policy overshoot.

Italian political infighting and discord has caused a move higher in Italian bond yields and risks another Eurozone crisis. In case you weren’t looking, Italian 2-year government bonds rose 1.83% yesterday to close at 2.70%, setting up another battle between Germany and the Eurozone’s southern region. While this one will likely be resolved as others have, with the Eurozone surviving, the pain to arrive at an agreement will be unpleasant and unsupportive of European economic growth. This matters because the ECB will have little appetite for QE tapering if Italy becomes a problem.

Ultimately, the upward ascent of U.S. bonds yields is running into resistance.

Disclosures: This is for informational purposes only and is not intended as investment advice or an offer or solicitation with respect to the purchase or sale of any security, strategy or investment product.  Although the statements of fact, information, charts, analysis and data in this report have been obtained from, and are based upon, sources Sage believes to be reliable, we do not guarantee their accuracy, and the underlying information, data, figures and publicly available information has not been verified or audited for accuracy or completeness by Sage.  Additionally, we do not represent that the information, data, analysis and charts are accurate or complete, and as such should not be relied upon as such.  All results included in this report constitute Sage’s opinions as of the date of this report and are subject to change without notice due to various factors, such as market conditions.  Investors should make their own decisions on investment strategies based on their specific investment objectives and financial circumstances.  All investments contain risk and may lose value.  Past performance is not a guarantee of future results.

Sage Advisory Services, Ltd. Co. is a registered investment adviser that provides investment management services for a variety of institutions and high net worth individuals.  For additional information on Sage and its investment management services, please view our web site at www.sageadvisory.com, or refer to our Form ADV, which is available upon request by calling 512.327.5530.

The Return of Inflation: A Relative Value Opportunity for Fixed Income Investors

Interest rates have increased dramatically since the end of 2017 and are expected to continue climbing. How can fixed income investors insulate themselves from inherent risks while taking advantage of the opportunities presented by this change in market dynamics? At Sage, we believe the best course of action is to make a strategic shift from fixed to floating rate bonds, which offer benefits that may not be so obvious to investors.

Market dynamics: Why rates will continue to rise

U.S. Treasury rates have increased for both fundamental and technical reasons, including commodity price increases, labor market tightening, and the Fed’s shrinking balance sheet.

Inflation expectations have in shot up in recent months due to an increase in commodity prices and tightening labor market conditions. With unemployment in the U.S. now below 4%, labor has become scarce, and thus wages should increase. The chart below shows the breakeven rates on Treasury inflation-protected securities (TIPS), used as a proxy for inflation expectations, which are on the rise.

Various geopolitical factors, including conflict with Iran, poor oil production performance from the leftist government in Venezuela, and increased global demand for liquefied petroleum products has caused the price of oil to increase dramatically in 2018.

In addition to these fundamental shifts, there is a large technical factor driving Treasury rates higher. The U.S. Federal Reserve’s Federal Open Market Committee (FOMC) has begun to shrink its balance sheet, allowing up to $10 billion of Treasuries and mortgages to “roll off” each month rather than reinvesting in those markets. The FOMC has been one of the largest buyers of U.S. Treasuries and mortgages, but is paring down assets to $2.5 trillion from $4.5 trillion at the peak. We anticipate that net global quantitative easing, used to support fixed income markets, will become negative by October, as the European Central Bank and the Bank of Japan also decrease their balance sheets.

What should fixed income investors do in a rising rate environment?

It may seem obvious that one would want to invest in floating rate bonds as interest rates increase, because rising rates will cause the coupons of floaters to rise in tandem with nominal rates, while fixed rate coupons will remain the same, causing the price of these bonds to decrease. But there is an additional benefit that may not be so obvious to most investors.

Floating rate asset-back securities (ABS), corporate bonds, and leveraged loans are all priced based on LIBOR, the London Interbank Offered Rate. This rate is set by a consortium of banks in the UK, and it is meant to represent the rate at which one bank would lend to another at various maturities. The ABS floaters generally price off the one-month LIBOR rate, while corporate securities generally use the three-month LIBOR rate as the benchmark. Because it is a rate of interest between banks, LIBOR has a credit component embedded along with pure interest rate considerations. As such, LIBOR rates tend to increase during periods of financial stress, while pure nominal interest rates tend to decline.

The chart below shows LIBOR versus the two-year U.S. Treasury. During the Dotcom Bubble, the Great Recession of 2008 and, to a lesser extent, during the European Debt Crisis of 2011, LIBOR increased while nominal rates decreased (as is typical in a “risk-off” environment).


This increase in LIBOR allows the coupon to increase to levels that will insulate bondholders somewhat from the dramatic spikes in both interest rates and credit spreads. The fixed income market has benefited from a prolonged low-spread and low-rate environment, but there’s reason to believe that may be coming to an end. As credit spreads increase concurrently with rising interest rates, we believe that floating rate bonds and loans are the best place for fixed income investors to achieve positive returns.

*Source on all charts is Bloomberg.

Disclosures: This is for informational purposes only and is not intended as investment advice or an offer or solicitation with respect to the purchase or sale of any security, strategy or investment product.  Although the statements of fact, information, charts, analysis and data in this report have been obtained from, and are based upon, sources Sage believes to be reliable, we do not guarantee their accuracy, and the underlying information, data, figures and publicly available information has not been verified or audited for accuracy or completeness by Sage.  Additionally, we do not represent that the information, data, analysis and charts are accurate or complete, and as such should not be relied upon as such.  All results included in this report constitute Sage’s opinions as of the date of this report and are subject to change without notice due to various factors, such as market conditions.  Investors should make their own decisions on investment strategies based on their specific investment objectives and financial circumstances.  All investments contain risk and may lose value.  Past performance is not a guarantee of future results.

Sage Advisory Services, Ltd. Co. is a registered investment adviser that provides investment management services for a variety of institutions and high net worth individuals.  For additional information on Sage and its investment management services, please view our web site at www.sageadvisory.com, or refer to our Form ADV, which is available upon request by calling 512.327.5530.


Rising Interest Rates: A Short Guide for ETF Investors

A rising tide lifts all boats, but do rising rates lift all assets? The yield on 10-year Treasury notes rose above 3% last week – the highest it’s been since 2014 – and the yield on two-year Treasury notes hasn’t been this high since the 2008 financial crisis.


When interest rates rise, many investors fear a negative effect on the economy. A combination of rising inflation, increased bond supply, and the Federal Reserve’s tightening policy have caused the recent increase in yields. In what ways could higher rates lead to lower growth, and more importantly, how should we as ETF investors position ourselves?


Higher Rates – A Risk Factor for The Economy?

Here are how higher interest rates could negatively affect growth:

  1. Rising interest expense for the corporate sector. Companies that finance their operations with debt incur interest expense, which drives down profit margins. According to JPMorgan, a 100 basis point increase in bond yields typically results in a 1.5% drag on S&P 500 earnings (not including financial services companies, which would see a benefit to earnings). Until recently, rates had remained relatively low since the financial crisis, and the lower interest expense has been a huge driver of corporate profit margins. Increasing rates would in theory reverse that trend. However, the impact of higher rates is mitigated by the fact that corporate debt has generally been issued at longer maturities (an average of 10-plus years) and at fixed rates, so rising interest expense is not an immediate concern at the macro level.
  2. Lower consumer demand due to rising interest expense for households. Higher interest expense decreases the level of disposable income, which should lower consumption and as a result, reduce GDP growth. This impact is somewhat mitigated as households have deleveraged over the past decade, and household debt service ratios remain at multi-decade lows.


How Higher Rates Negatively Affect Equities:

  1. Reduced value of future earnings. In its purest form, equity prices reflect the discounted future earnings of a company. Higher interest rates increase the discount rate, thereby lowering the company’s present value. If rising interest rates aren’t offset with higher top-line growth, either through higher prices (inflation) or higher volume (more demand), then equities could be in trouble as market participants price in a higher discount rate.
  2. Declining attractiveness of equities as earnings yields decline. When earnings yields significantly exceed bond yields, it becomes cheaper for companies to finance projects, M&A, and share repurchase programs. When the difference between earnings yields and bond yields is zero or negative, the equity-market boosting behaviors could slow or stop. With increasing bond yields and high stock valuations, that gap has been decreasing, but it still remains at above-average levels. So while it’s not a red flag yet, if the gap continues to narrow, it could drive stock prices lower.

A rising rate environment does not signal immediate danger for the economy, since the private sector has deleveraged a great deal since the crisis and the Fed has been very methodical in communicating future rate hikes. However, markets are forward-looking and investors could start to price in the effect of higher interest rates on financial assets before they actually materialize. At Sage, we believe sectors that stand to outperform from rising rates are financial services, such as banks and insurance companies; inflation-protected bonds; and the senior loan market, which provides exposure to corporate debt without the corresponding interest rate risk.


Disclosures: This is for informational purposes only and is not intended as investment advice or an offer or solicitation with respect to the purchase or sale of any security, strategy or investment product.  Although the statements of fact, information, charts, analysis and data in this report have been obtained from, and are based upon, sources Sage believes to be reliable, we do not guarantee their accuracy, and the underlying information, data, figures and publicly available information has not been verified or audited for accuracy or completeness by Sage.  Additionally, we do not represent that the information, data, analysis and charts are accurate or complete, and as such should not be relied upon as such.  All results included in this report constitute Sage’s opinions as of the date of this report and are subject to change without notice due to various factors, such as market conditions.  Investors should make their own decisions on investment strategies based on their specific investment objectives and financial circumstances.  All investments contain risk and may lose value.  Past performance is not a guarantee of future results.

Sage Advisory Services, Ltd. Co. is a registered investment adviser that provides investment management services for a variety of institutions and high net worth individuals.  For additional information on Sage and its investment management services, please view our web site at www.sageadvisory.com, or refer to our Form ADV, which is available upon request by calling 512.327.5530.

Measuring the Impact of Your Municipal Bond ESG Portfolio

Investors have long considered municipal bonds to be a way to invest in community-focused development, but measuring impact can be difficult. Until very recently, muni investors had to be content with having only a limited understanding of the nature, intensity, and duration of the financing’s impact at the local level. That changed in 2015 with the introduction of the United Nations Sustainable Development Goals 2030 (SDGs) framework.

The SDGs identified a global impact construct that offered investors a basis upon which to measure their investing. There are 17 core SDGs along with 169 performance sub-targets. The SDGs cover a broad range of social and economic development issues, including poverty, education, climate change, gender equality, sanitation, energy, environment, and social justice. The 169 sub-targets are used to measure progress toward reaching the target and ultimately accomplishing the stated core goal by 2030. This comprehensive framework allows organizations to align their projects with a broad global goal and have a measurable, target-based action plan to get there.

The United Nations Sustainable Development Goals 2030

(Source: United Nations)

The process for measuring ESG impact has become more standardized for publicly held companies, but ESG assessment tools have generally been unavailable and not often applied to municipal bond investing. Following the introduction of the UN’s SDGs, Sage developed a proprietary framework to evaluate the ESG impact associated with individual municipal investments. Through this framework, Sage first classifies each municipal entity within an issuer category or reference peer group. Then, after an in-depth review of the issuer’s relevant financial data and the entity’s ESG-related information, Sage assigns three scores: an overall ESG score, an impact score that evaluates the ESG-related relevancy of the project, and an impact intensity score that measures the magnitude of the project’s impact on the surrounding environment and/or community.

One of Sage’s municipal holdings is Aurora, Colorado, Water Revenue Bonds (5% due 8/1/2046 that are rated AA+/AA+). The proceeds are being used to fund the Prairie Waters Project, which will provide a sustainable long-term water supply under drought conditions to the city’s growing population. The project has resulted in more efficient utilization of water supply and has increased the availability of water by 20%. The project category is classified as Water Treatment, which would map to SDG 6, “Clean Water and Sanitation,” and SDG 11, “Sustainable Cities and Communities.”

Once Sage selects securities, the overall portfolio is evaluated in terms of its fundamental financial risk characteristics, i.e., credit quality, maturity, effective duration, and call features. In addition, the portfolio is evaluated in terms of its overall ESG risk characteristics relative to its historical trends, the level of anticipated community impact, and finally, the expected community impact intensity accruing from the projects represented within the portfolio.

Each month, Sage produces a report for each client invested in our ESG strategy. The report illustrates general holdings and security characteristics, in addition to offering a broader context to better understand local ESG impact levels and global SDG alignment at both the individual security and portfolio levels. These monthly reports enable ESG investors to know on an ongoing basis if they are making the right decisions as they strive for a better “double bottom line.”


Disclosures: This is for informational purposes only and is not intended as investment advice or an offer or solicitation with respect to the purchase or sale of any security, strategy or investment product. Although the statements of fact, information, charts, analysis and data in this report have been obtained from, and are based upon, sources Sage believes to be reliable, we do not guarantee their accuracy, and the underlying information, data, figures and publicly available information has not been verified or audited for accuracy or completeness by Sage. Additionally, we do not represent that the information, data, analysis and charts are accurate or complete, and as such should not be relied upon as such. All results included in this report constitute Sage’s opinions as of the date of this report and are subject to change without notice due to various factors, such as market conditions. Investors should make their own decisions on investment strategies based on their specific investment objectives and financial circumstances. All investments contain risk and may lose value. Past performance is not a guarantee of future results.

Sage Advisory Services, Ltd. Co. is a registered investment adviser that provides investment management services for a variety of institutions and high net worth individuals. For additional information on Sage and its investment management services, please view our web site at www.sageadvisory.com, or refer to our Form ADV, which is available upon request by calling 512.327.5530.