The Four Seasons of Muni Bond Investing

Timing is everything. For a municipal bond investor, annual seasonal trends can provide great entry and exit points, if executed properly. There are four distinct seasonal periods that occur annually due to structural factors inherent in the municipal bond market. If timed correctly, municipal investors can increase their probability of successfully trading these markets and reap the reward of better returns.

The four seasonal periods that affect the municipal market on an annual basis are January Reinvestment, Tax Season, June/July Redemptions, and the Holiday Season Slowdown.

January Reinvestment

Although not the heaviest period of bond maturity and coupon payments, January 1st does experience an elevated level of cash that needs to be reinvested. In addition, the lingering effects of the Holiday Season Slowdown contribute to a limited amount of new issue supply, as well as diminished levels of secondary supply offered by broker/dealers. This strong technical environment tends to last anywhere from a few weeks to well into February, depending on the direction and magnitude of market flows. For investors who can time liquidity needs, January represents one of the most advantageous times of year to raise funds.

Tax Season – late March through April

From late March until the end of April, the municipal bond market tends to see both a reduction in demand as well as a heightened level of selling to fund tax payments. (Selling tax-exempt municipal bonds to fund personal federal and state tax liabilities remains one of life’s great mysteries.) Regardless, tax season provides an attractive entry point for investors, as limited demand and improving new issue supply tend to push valuations to more attractive levels.

June/July Redemptions

The heaviest period of maturing bonds and coupon payments is during these two months and represents anywhere from 40% to 60% of annual redemptions. Typically, municipal issuers come to market during this time, which offsets the demand pressure from reinvestment. Unfortunately, over the past several years, municipalities have been paying down debt and reducing debt issuance, which has created a net negative supply environment. As long as new issuance remains below the long-term averages, municipal bonds will remain supportive during June and July and provide investors an opportune time to rebalance portfolios (such as reducing credit risk).

Holiday Season – late November through year-end

Thanksgiving should indicate a warning sign to investors regarding optimal liquidity and ample supply. During the week of Thanksgiving, the markets may be open; however, the focus of the market is limited. The last week of November and the first two weeks of December represent the final opportunity for investors to efficiently trade before the market essentially shuts down for the year. Junior traders and reduced staff remain the norm during the last two weeks of the year. Market making and risk taking are severely restricted and a noticeable liquidity premium on bonds is apparent. Fortunately, for those investors looking to put cash to work, the ability to purchase bonds from forced market sells offers the opportunity to add exposure at discounted levels.

Sage has always believed that a well-informed investor is a successful investor. Investors looking to make strategic and tactical shifts into and out of municipal bonds can enhance returns by timing seasonal effects appropriately. By combining Sage’s value-based investment strategy with seasonal timing of cash flow, investors will be able to maximize market liquidity and optimize return potential.


Disclosures: This is for informational purposes only and is not intended as investment advice or an offer or solicitation with respect to the purchase or sale of any security, strategy or investment product. Although the statements of fact, information, charts, analysis and data in this report have been obtained from, and are based upon, sources Sage believes to be reliable, we do not guarantee their accuracy, and the underlying information, data, figures and publicly available information has not been verified or audited for accuracy or completeness by Sage. Additionally, we do not represent that the information, data, analysis and charts are accurate or complete, and as such should not be relied upon as such. All results included in this report constitute Sage’s opinions as of the date of this report and are subject to change without notice due to various factors, such as market conditions. Investors should make their own decisions on investment strategies based on their specific investment objectives and financial circumstances. All investments contain risk and may lose value. Past performance is not a guarantee of future results.

Sage Advisory Services, Ltd. Co. is a registered investment adviser that provides investment management services for a variety of institutions and high net worth individuals. For additional information on Sage and its investment management services, please view our web site at www.sageadvisory.com, or refer to our Form ADV, which is available upon request by calling 512.327.5530.


Pensions Enjoy Lump-Sum Savings in 2019

Lump sum offerings can be valuable in transferring risk away the from plan sponsor by reducing a defined benefit plan’s overall liability exposure. Lump sums can be costly, especially in today’s low interest rate environment, and can have a negative effect on a plan’s funded status. But since interest rates rose during 2018, the result in many cases is lower lump-sum present values in 2019.

As a refresher, pension-plan sponsors generally account for the possibility that they will pay out benefits to their participants over many years. However, if participants choose to receive lump sums, the plan makes a single payment per participant, rather than multiple payments over several years. The result is a reduction of liabilities that the plan carries forward.

The IRS mandates that lump-sum payouts must meet minimum present values as determined in IRC 417(e)(3), with interest rate assumptions derived from mark-to-market corporate bond yields. The plan document defines the method of calculating lump sums with respect to IRC 417(e). Most commonly, a plan will be able to value lump sums with segment rates that are fixed for the entire plan year. This means that any lump-sum payments made in any time of the plan year will use the same segment rates.

For example, if a plan has a stability period of a year, a lookback month of 2, and the lump-sum calculations are for the 2019 plan year (calendar year plan), the November 2018 417(e) rates will be used for all lump sum payouts that occur in 2019. This is important because this means that lump-sum values can vary dramatically from one year to the next based on moves in interest rates and/or mortality assumption updates.

Exhibit 1 shows the changes in the 417(e) segment rates with varying lookback months (based on a calendar year basis). Overall, the rates have increased in 2018.


 Exhibit 1. Change in 417(e) segment rates from 2018 to 2019.


Until recently, the last several years have been a series of declining rates. Exhibit 2 shows the historical November 417(e) rates over the last decade. Long term rates (Segment 2 and 3) have been generally trending downwards since November 2013. This means, generally speaking, that each subsequent year’s lump-sum present values since the 2014 plan year have been more costly than in its prior year. The rate increase from November 2017 to November 2018 is the first substantial increase we have seen since 2013.


Exhibit 2: Historical November 417(e) Segment Rates


How much have lump-sum costs declined from the 2018 to 2019 plan year? To answer, let’s assume that the stability period is a year, and the lookback month is 2. We assume a normal retirement age of 65, and adjust for the population aging 1 year from 2018.

Exhibit 3 shows the result of the change in the minimum present values from 2018 to 2019 at varying ages of a $1,000 monthly accrued benefit. The overwhelming result is that lump sums payable in 2019 are less than those paid in 2018. The leading factor is the change in rates that occurred in 2018. Mortality rates were also higher in the 2019 tables than 2018, which also contributed to the decline in the present values, but they account for less than 1% of the change.


Exhibit 3. Lump sum changes from 2018 to 2019


Conclusion

In summary, lump sums in 2019 are much less costly than in 2018. Plan sponsors might even find that more participants are eligible for the $5,000 involuntary cash-outs due to this reduction. With the 2019 PBGC per-participant premium up 40% from 2015, reducing liability exposure can help long-term savings on the plan’s ongoing expenses. Overall, 2019 may be an opportune time to take advantage of lower lump-sum values.

There are also implications for managers of liability-driven investment (LDI) strategies. Plans often discover that lump-sum payouts affect the duration of their liabilities, which should prompt asset managers to adjust their portfolios accordingly. At Sage, we work as fiduciaries with our pension-plan clients to ensure that we operate with the most current actuarial data so that the LDI portfolios we manage maintain tight durations relative to liability benchmarks. That ensures that the asset allocation remains effective, even with changes to projected liabilities resulting from lump-sum payouts or any other events.


Disclosures: This is for informational purposes only and is not intended as investment advice or an offer or solicitation with respect to the purchase or sale of any security, strategy or investment product. Although the statements of fact, information, charts, analysis and data in this report have been obtained from, and are based upon, sources Sage believes to be reliable, we do not guarantee their accuracy, and the underlying information, data, figures and publicly available information has not been verified or audited for accuracy or completeness by Sage. Additionally, we do not represent that the information, data, analysis and charts are accurate or complete, and as such should not be relied upon as such. All results included in this report constitute Sage’s opinions as of the date of this report and are subject to change without notice due to various factors, such as market conditions. Investors should make their own decisions on investment strategies based on their specific investment objectives and financial circumstances. All investments contain risk and may lose value. Past performance is not a guarantee of future results.

Sage Advisory Services, Ltd. Co. is a registered investment adviser that provides investment management services for a variety of institutions and high net worth individuals. For additional information on Sage and its investment management services, please view our web site at www.sageadvisory.com, or refer to our Form ADV, which is available upon request by calling 512.327.5530.

Valuations Become Attractive for Longer-Maturity Municipal Bonds

With investor demand focused on the front end of the yield curve, longer maturities have been neglected, leading to a divergence from Treasury yield movements. We believe valuations for long-dated municipal bonds offer the high-taxed individual an attractive entry point here.

The 30-Year Municipal to Treasury ratio, M/T for short, is a common valuation indicator that can easily spot undervalued and overvalued market conditions. As of early February, the 30-Year M/T ratio was greater than 100%, which has historically been a great time to enter the market.


The benefit to taxable investors is that current 30-year municipal yields are offered at the same yield level as equivalent Treasuries. For an investor with a 35% effective tax rate, the after-tax benefit for owning municipal bonds equates to approximately 1.00% of additional yield. If investors can withstand a modest level of price volatility, extending the maturity profile of a portfolio’s bond allocation will pay dividends over time.


Disclosures: This is for informational purposes only and is not intended as investment advice or an offer or solicitation with respect to the purchase or sale of any security, strategy or investment product. Although the statements of fact, information, charts, analysis and data in this report have been obtained from, and are based upon, sources Sage believes to be reliable, we do not guarantee their accuracy, and the underlying information, data, figures and publicly available information has not been verified or audited for accuracy or completeness by Sage. Additionally, we do not represent that the information, data, analysis and charts are accurate or complete, and as such should not be relied upon as such. All results included in this report constitute Sage’s opinions as of the date of this report and are subject to change without notice due to various factors, such as market conditions. Investors should make their own decisions on investment strategies based on their specific investment objectives and financial circumstances. All investments contain risk and may lose value. Past performance is not a guarantee of future results.

Sage Advisory Services, Ltd. Co. is a registered investment adviser that provides investment management services for a variety of institutions and high net worth individuals. For additional information on Sage and its investment management services, please view our web site at www.sageadvisory.com, or refer to our Form ADV, which is available upon request by calling 512.327.5530.

Notes from the Desk: Central Banks Are No Longer a Major Pain Point

With the interest rate markets pricing in no hikes for 2019, there was room for the FOMC to disappoint at its January meeting; however, they ended up surpassing the most dovish of expectations. As a result, risk assets rallied sharply in January as global central banks followed in the Fed’s footsteps in easing financial conditions.

In his statements, Chairman Powell signaled that the case for additional rate hikes had weakened and declined to rule out that the next move in rates would be lower. Most importantly, the Fed said that it was prepared to adjust its balance sheet normalization to economic and financial developments. Basically, if raising rates or lowering the size of the Fed’s balance sheet turns out to negatively affect markets, Powell and the FOMC would adjust policy as necessary.

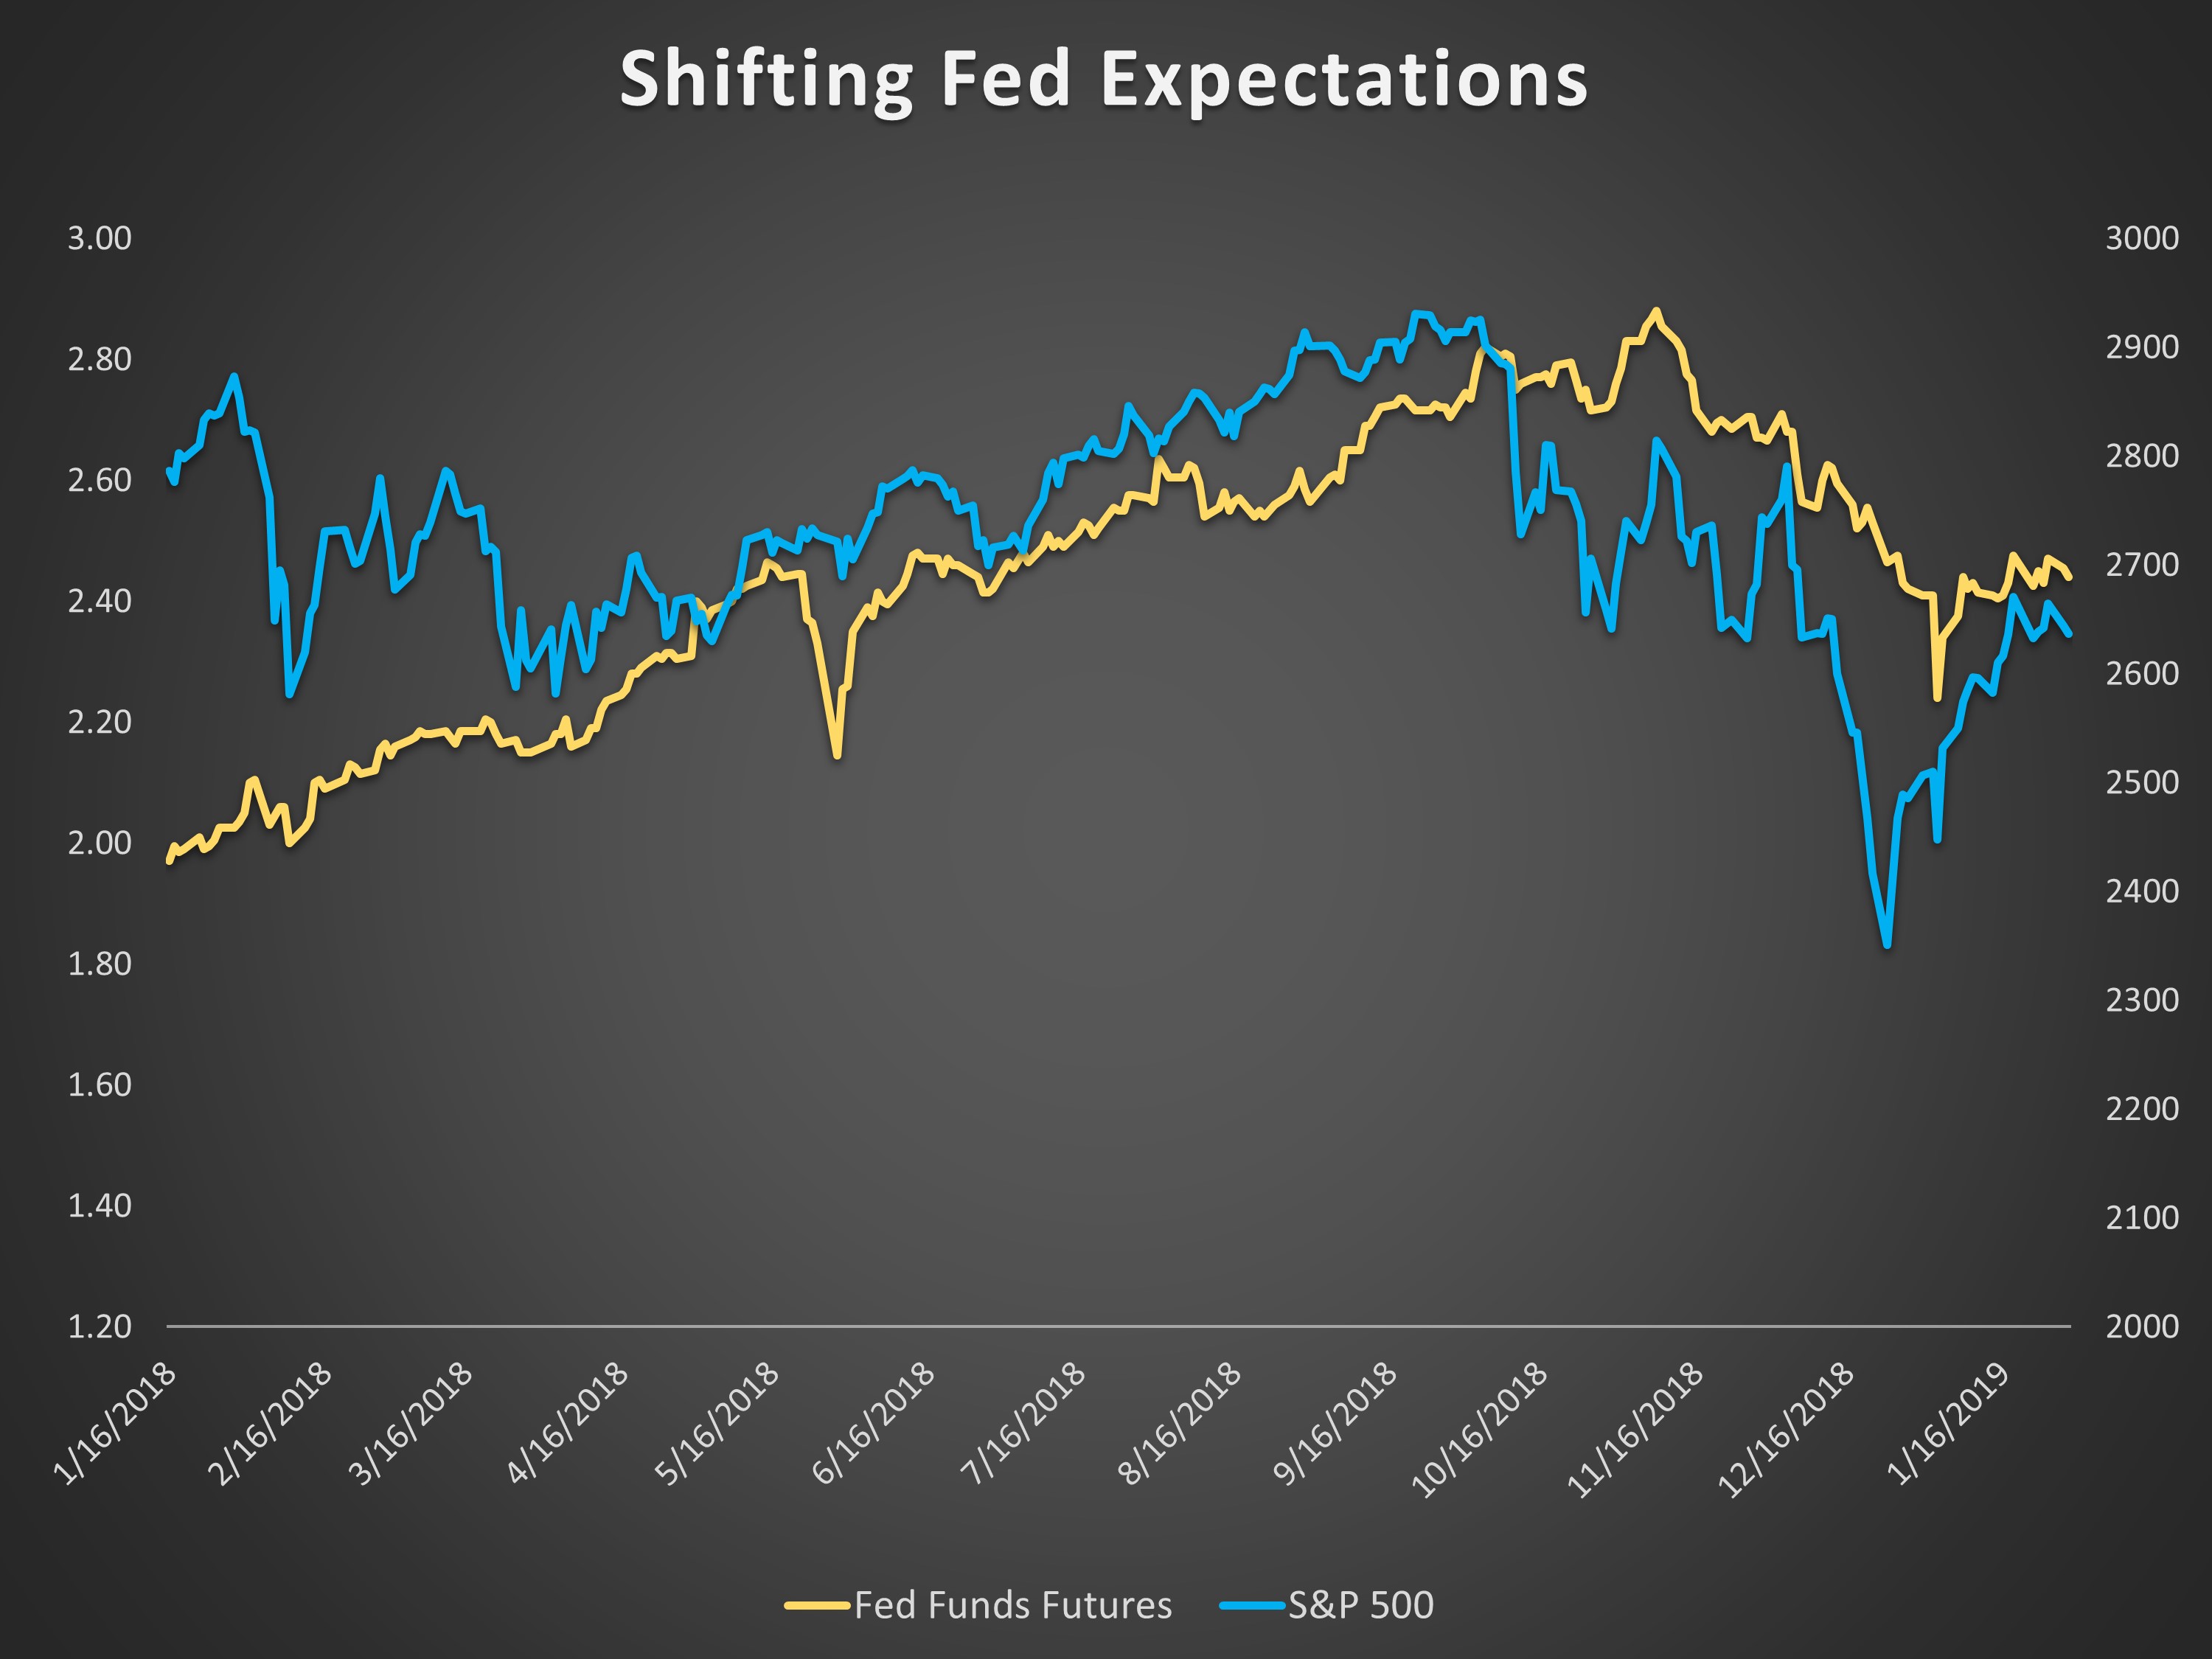
Thus resumes the cycle of central bank policy acting in response to financial markets. The chart below shows the 12-month forward federal funds rate compared to the S&P 500. Expectations of Fed policy have traded in lockstep with the equity markets.


Given our focus on balance sheet policy as a source of risk asset fragility, this action removes a major point of uncertainty for financial markets over the next few months. We’re still wary of a material slowing in the global economy, but as of this week – it doesn’t look like central banks will be part of the problem.


Disclosures: This is for informational purposes only and is not intended as investment advice or an offer or solicitation with respect to the purchase or sale of any security, strategy or investment product. Although the statements of fact, information, charts, analysis and data in this report have been obtained from, and are based upon, sources Sage believes to be reliable, we do not guarantee their accuracy, and the underlying information, data, figures and publicly available information has not been verified or audited for accuracy or completeness by Sage. Additionally, we do not represent that the information, data, analysis and charts are accurate or complete, and as such should not be relied upon as such. All results included in this report constitute Sage’s opinions as of the date of this report and are subject to change without notice due to various factors, such as market conditions. Investors should make their own decisions on investment strategies based on their specific investment objectives and financial circumstances. All investments contain risk and may lose value. Past performance is not a guarantee of future results.

Sage Advisory Services, Ltd. Co. is a registered investment adviser that provides investment management services for a variety of institutions and high net worth individuals. For additional information on Sage and its investment management services, please view our web site at www.sageadvisory.com, or refer to our Form ADV, which is available upon request by calling 512.327.5530.

Municipal Sector Insight: Higher Education

Larger institutions to benefit from years of tuition inflation.


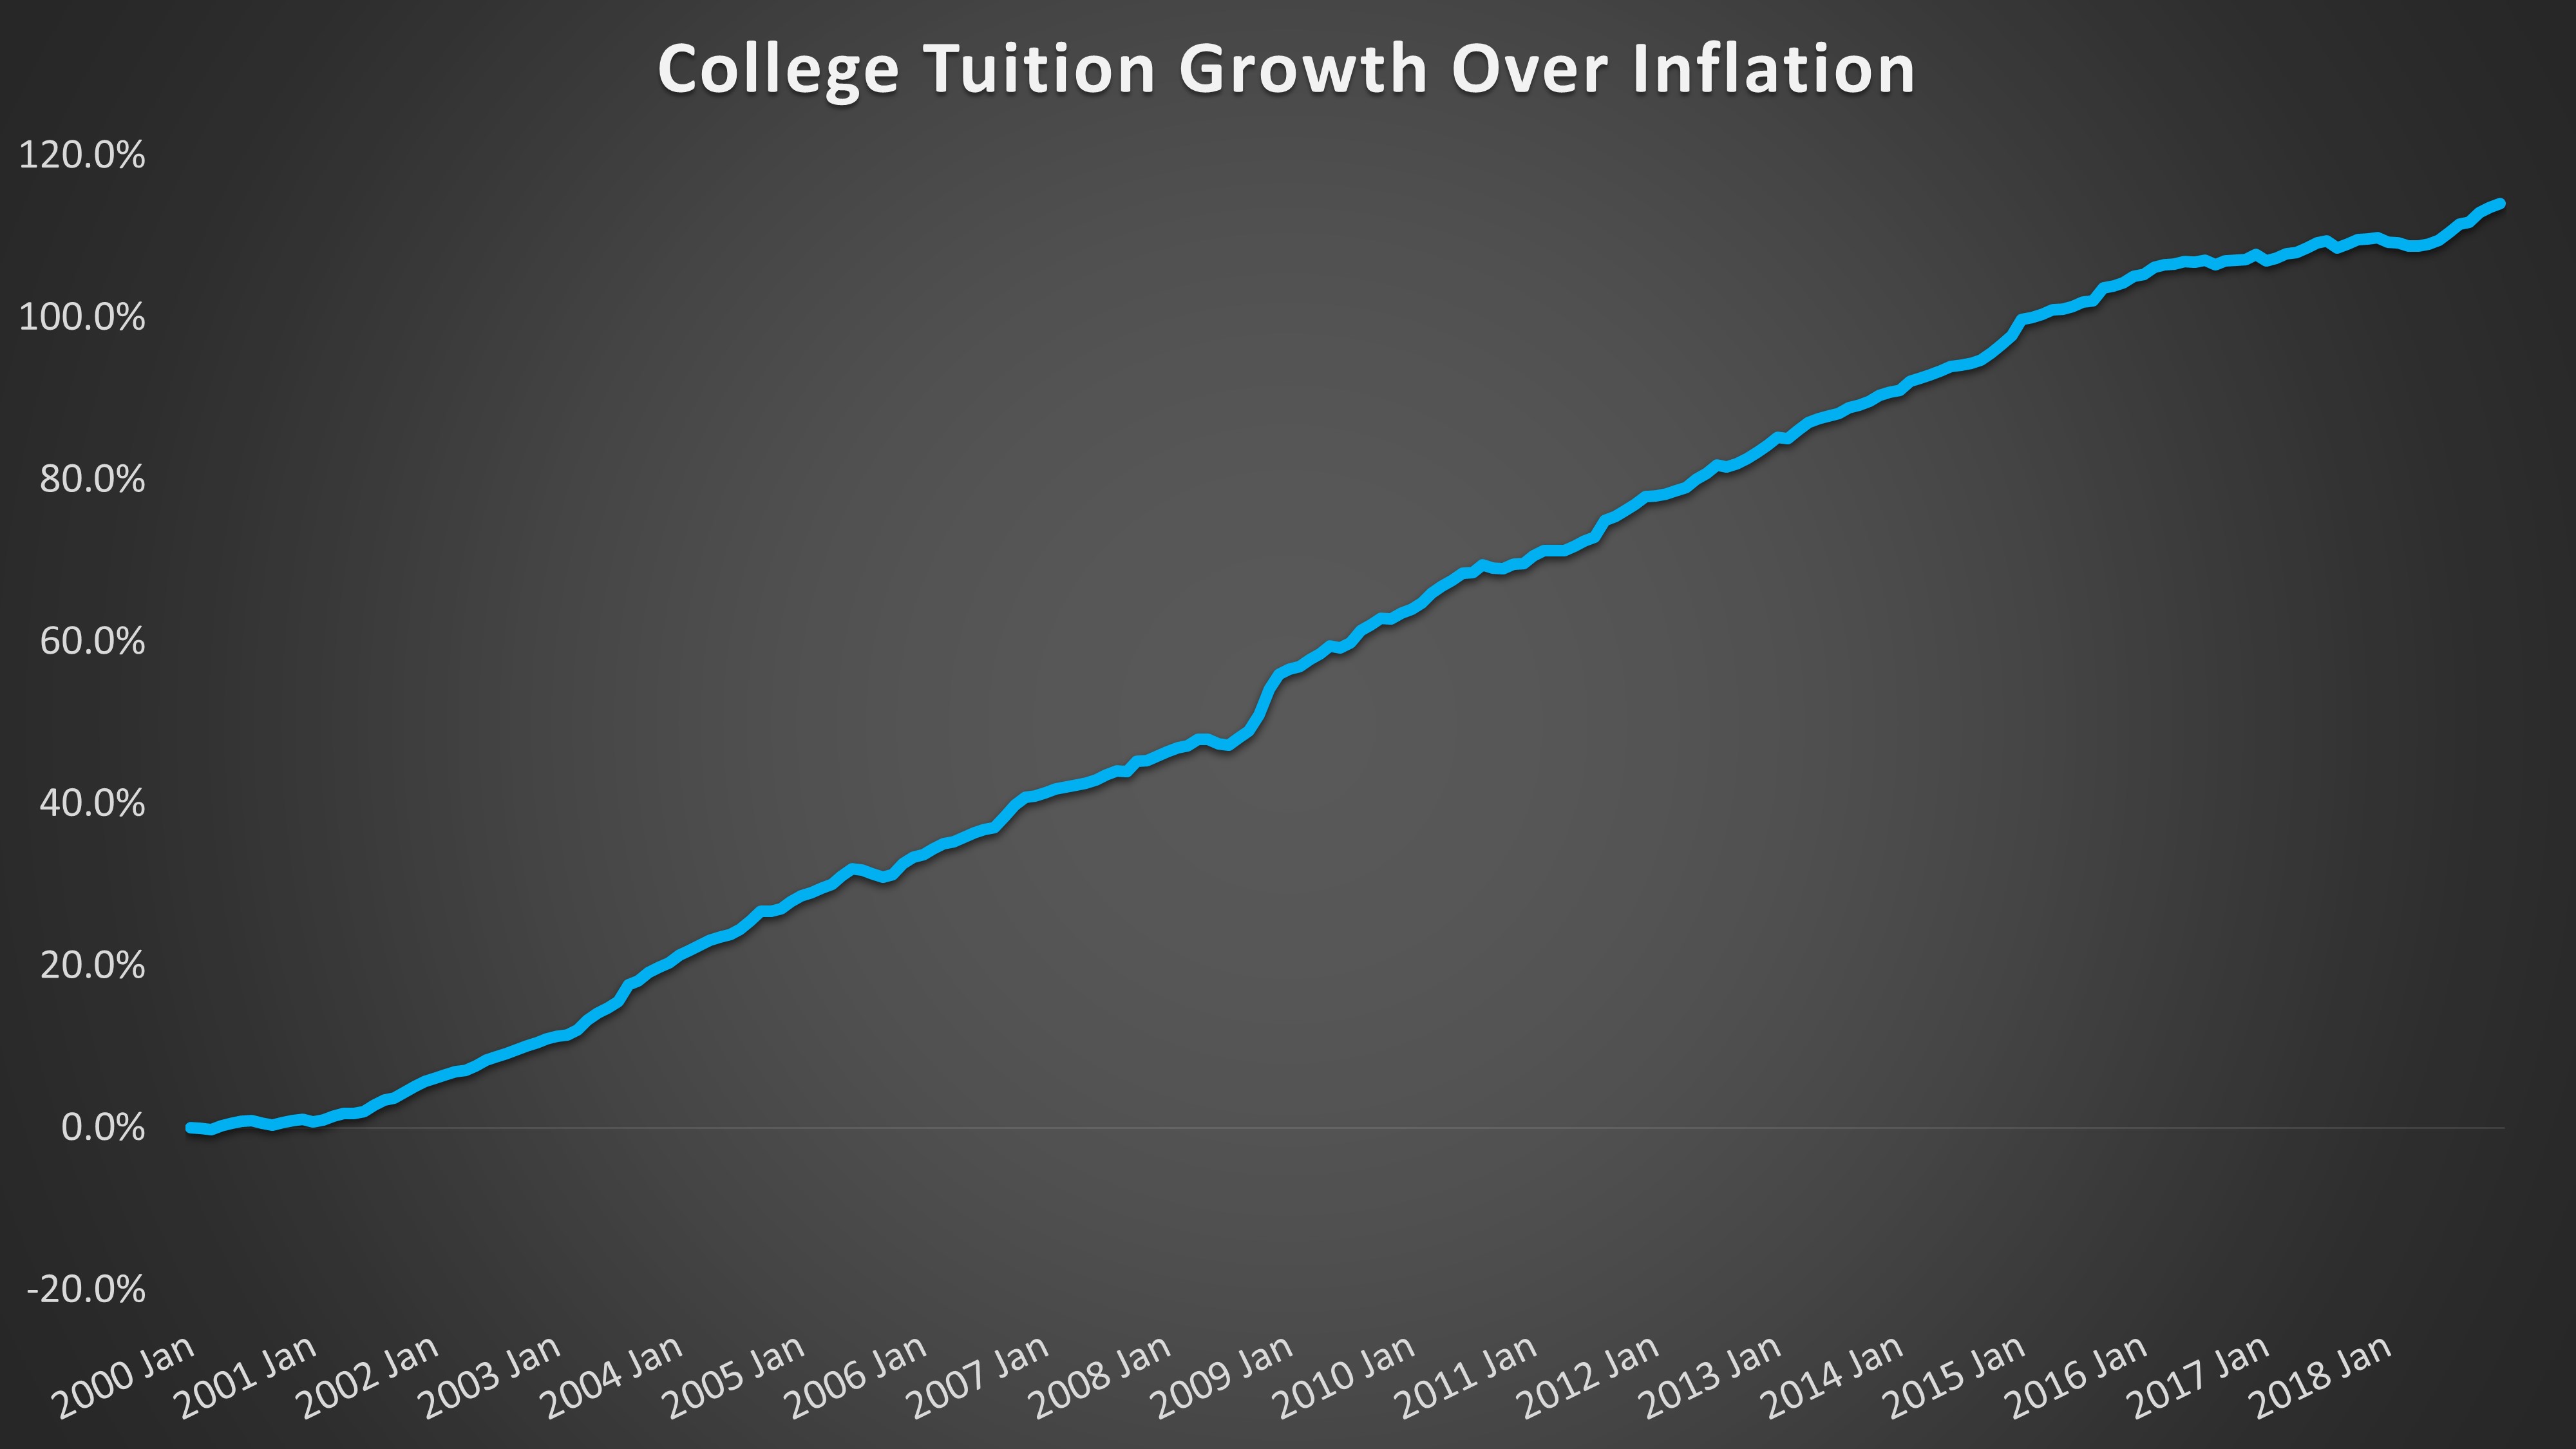
The Higher Education sector represents one of the safer areas of the municipal market due to a national priority placed on advanced education, a large pool of applicants across multiple academic disciplines, and modest-to-significant endowment funds to provide credit support, to name a few. Despite the inherent safety of the sector, almost two decades of above-inflation tuition increases have finally disrupted the supply and demand dynamic. Since 2000, college tuition inflation has outpaced Consumer Price Inflation (CPI) by almost 120%; therefore, student demand has become more discerning as students now more carefully consider the risk/reward of their continued education. With this backdrop, bondholders will be required to perform more intensive credit analysis on smaller colleges and universities.


The Higher Education sector consists mostly of public and private colleges and universities that issue municipal bonds. In the current environment, mid-to-large institutions with national recognition, particularly state universities, will likely benefit from tuition increases as lower relative tuition combined with higher job placement and larger starting salaries becomes a determining factor for graduates. Smaller boutique colleges, with limited notoriety and academic prominence, are seeing lower enrollment levels, as well as a decrease in applicants. One recent casualty was Vermont’s Green Mountain College, a small liberal arts institute that finally closed its doors after 183 years. Sage anticipates that similarly positioned colleges will follow suit over the next three-to-five years.

Sage will continue to hold a diversified allocation to Higher Education credits that maintain a strong credit profile, have stable-to-improving enrollment levels, and have a strong national or regional presence. As a result of our stable credit outlook, relative valuations will be the determining factor regarding portfolio positioning for Higher Education credits.


Disclosures: This is for informational purposes only and is not intended as investment advice or an offer or solicitation with respect to the purchase or sale of any security, strategy or investment product. Although the statements of fact, information, charts, analysis and data in this report have been obtained from, and are based upon, sources Sage believes to be reliable, we do not guarantee their accuracy, and the underlying information, data, figures and publicly available information has not been verified or audited for accuracy or completeness by Sage. Additionally, we do not represent that the information, data, analysis and charts are accurate or complete, and as such should not be relied upon as such. All results included in this report constitute Sage’s opinions as of the date of this report and are subject to change without notice due to various factors, such as market conditions. Investors should make their own decisions on investment strategies based on their specific investment objectives and financial circumstances. All investments contain risk and may lose value. Past performance is not a guarantee of future results.

Sage Advisory Services, Ltd. Co. is a registered investment adviser that provides investment management services for a variety of institutions and high net worth individuals. For additional information on Sage and its investment management services, please view our web site at www.sageadvisory.com, or refer to our Form ADV, which is available upon request by calling 512.327.5530.


Pensions: Don’t Repeat Mistakes of the Past

In 2019, by most accounts, corporate defined benefit (DB) plans are pretty well-funded. Their equity allocations benefited from the 10-year bull market, and their liabilities have come down as interest rates have risen from their post-crisis lows. Higher assets plus lower liabilities equals better funding levels.

But since these favorable conditions will not last forever, the prudent next step is for plans to lock in their high funding levels. In other words, prepare now for the next downturn.

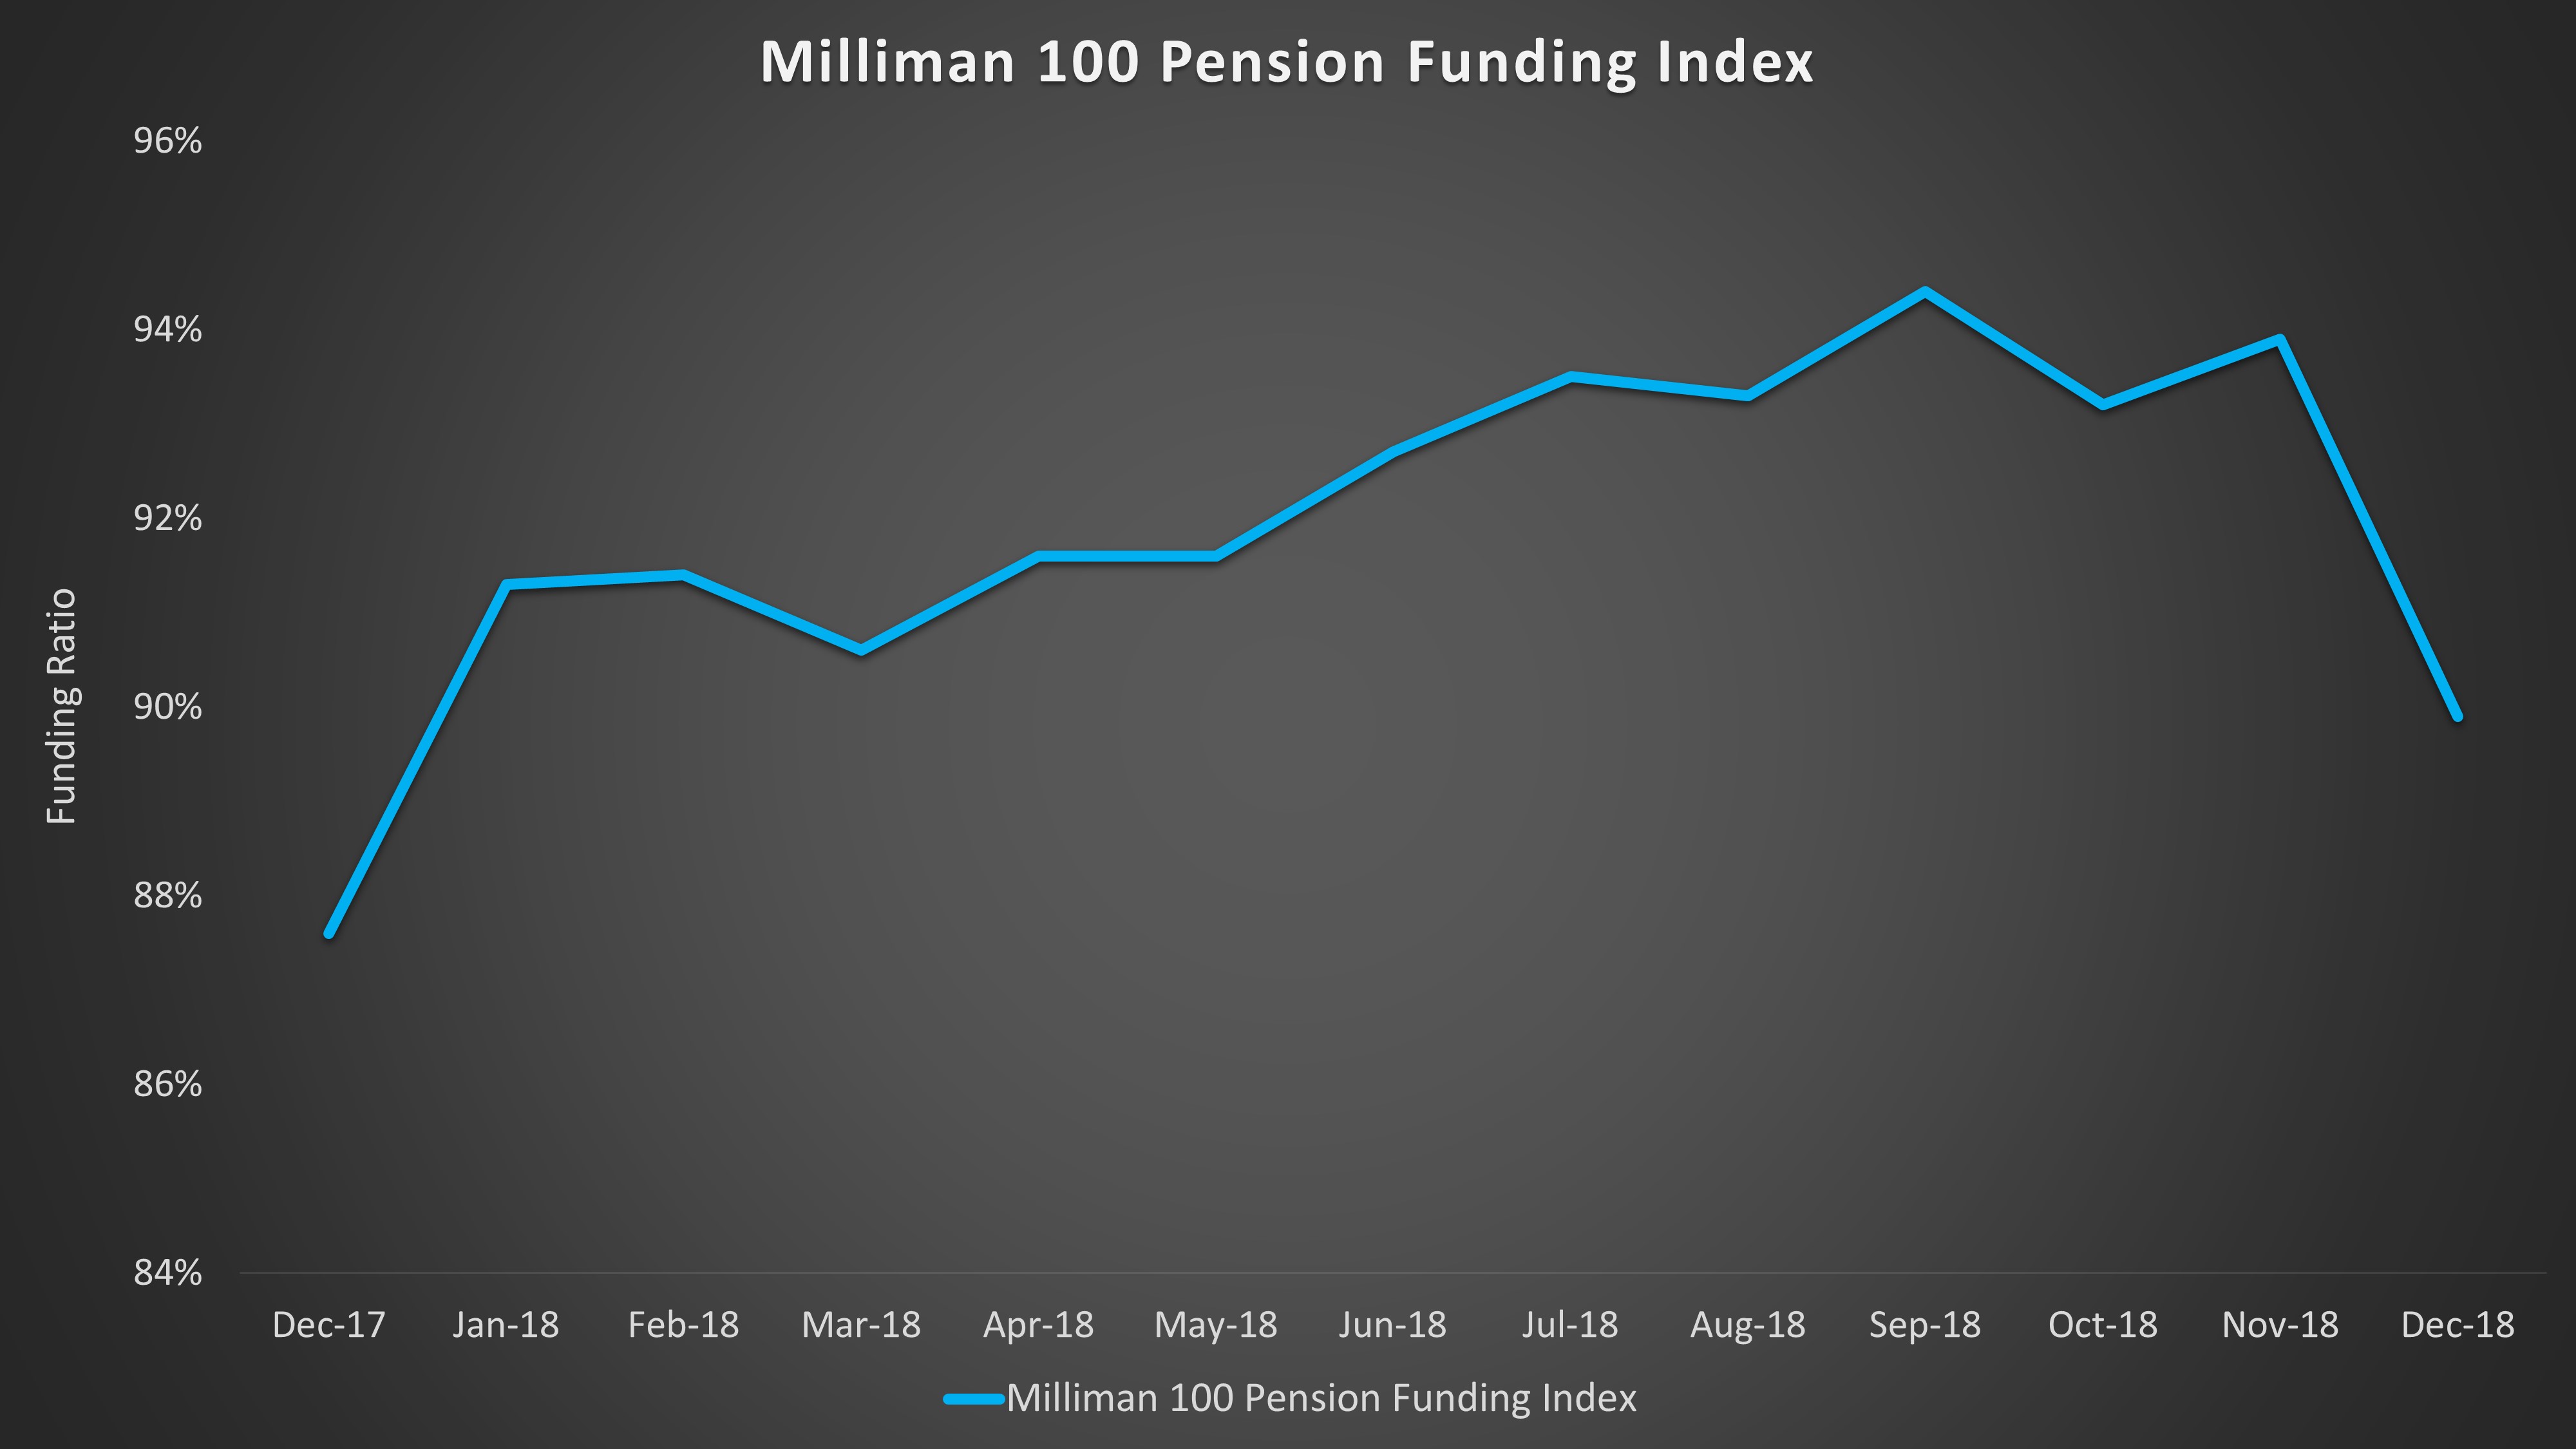
The 2008 Financial Crisis devastated the pension industry, partly because many well-funded plans were too heavily weighted toward risky assets. Since the crisis, corporate plans have done a good job repairing their level of funding. The Milliman 100 Pension Funding Index, which projects the funded status of the 100 largest U.S. corporate DB plans, ended 2018 at roughly 90% funded. But 2018 also provided evidence that markets can reverse quickly. Equity markets suffered double-digit losses, and the Milliman index dropped 4.5% from its peak in September.

Source: Milliman, as of 12/31/2018

Even though most corporate pension plans lost ground in the fourth quarter, it’s important to note that the Milliman index, at 90% funded, is still 20% higher than it was in August 2010. For plans that have successfully rebuilt their funding, we recommend a shift from capital-appreciation mode to capital-preservation mode. This means reducing allocations to risk-seeking assets (such as equities) and transitioning to more liability-driven investments.

Sage tailors liability-driven investment portfolios to the specific liabilities of DB plans. That means no two LDI portfolios are identical. Well-designed LDI strategies should keep duration and volatility levels in-line with their liability benchmarks and serve as effective hedges against interest rate risk. As interest rates rise or fall, LDI portfolios should minimize volatility of the plan’s funded status.

For plans that choose not to hedge against market volatility, the result could be larger required contributions during the next market downturn. It is not a question of if, but when.


Disclosures: This is for informational purposes only and is not intended as investment advice or an offer or solicitation with respect to the purchase or sale of any security, strategy or investment product. Although the statements of fact, information, charts, analysis and data in this report have been obtained from, and are based upon, sources Sage believes to be reliable, we do not guarantee their accuracy, and the underlying information, data, figures and publicly available information has not been verified or audited for accuracy or completeness by Sage. Additionally, we do not represent that the information, data, analysis and charts are accurate or complete, and as such should not be relied upon as such. All results included in this report constitute Sage’s opinions as of the date of this report and are subject to change without notice due to various factors, such as market conditions. Investors should make their own decisions on investment strategies based on their specific investment objectives and financial circumstances. All investments contain risk and may lose value. Past performance is not a guarantee of future results.

Sage Advisory Services, Ltd. Co. is a registered investment adviser that provides investment management services for a variety of institutions and high net worth individuals. For additional information on Sage and its investment management services, please view our web site at www.sageadvisory.com, or refer to our Form ADV, which is available upon request by calling 512.327.5530.
Energy’s Sharp Rebound Reflects Dramatic Sentiment Shift

While a further rally in risk assets and a compression in credit spreads will require a follow-through by the Fed as a well as cooling of trade tensions, the Fed has done its part to quell market volatility to start off 2019. One sector that has had a particularly strong rebound is Energy.


Atlas Shrugged, Powell Paused

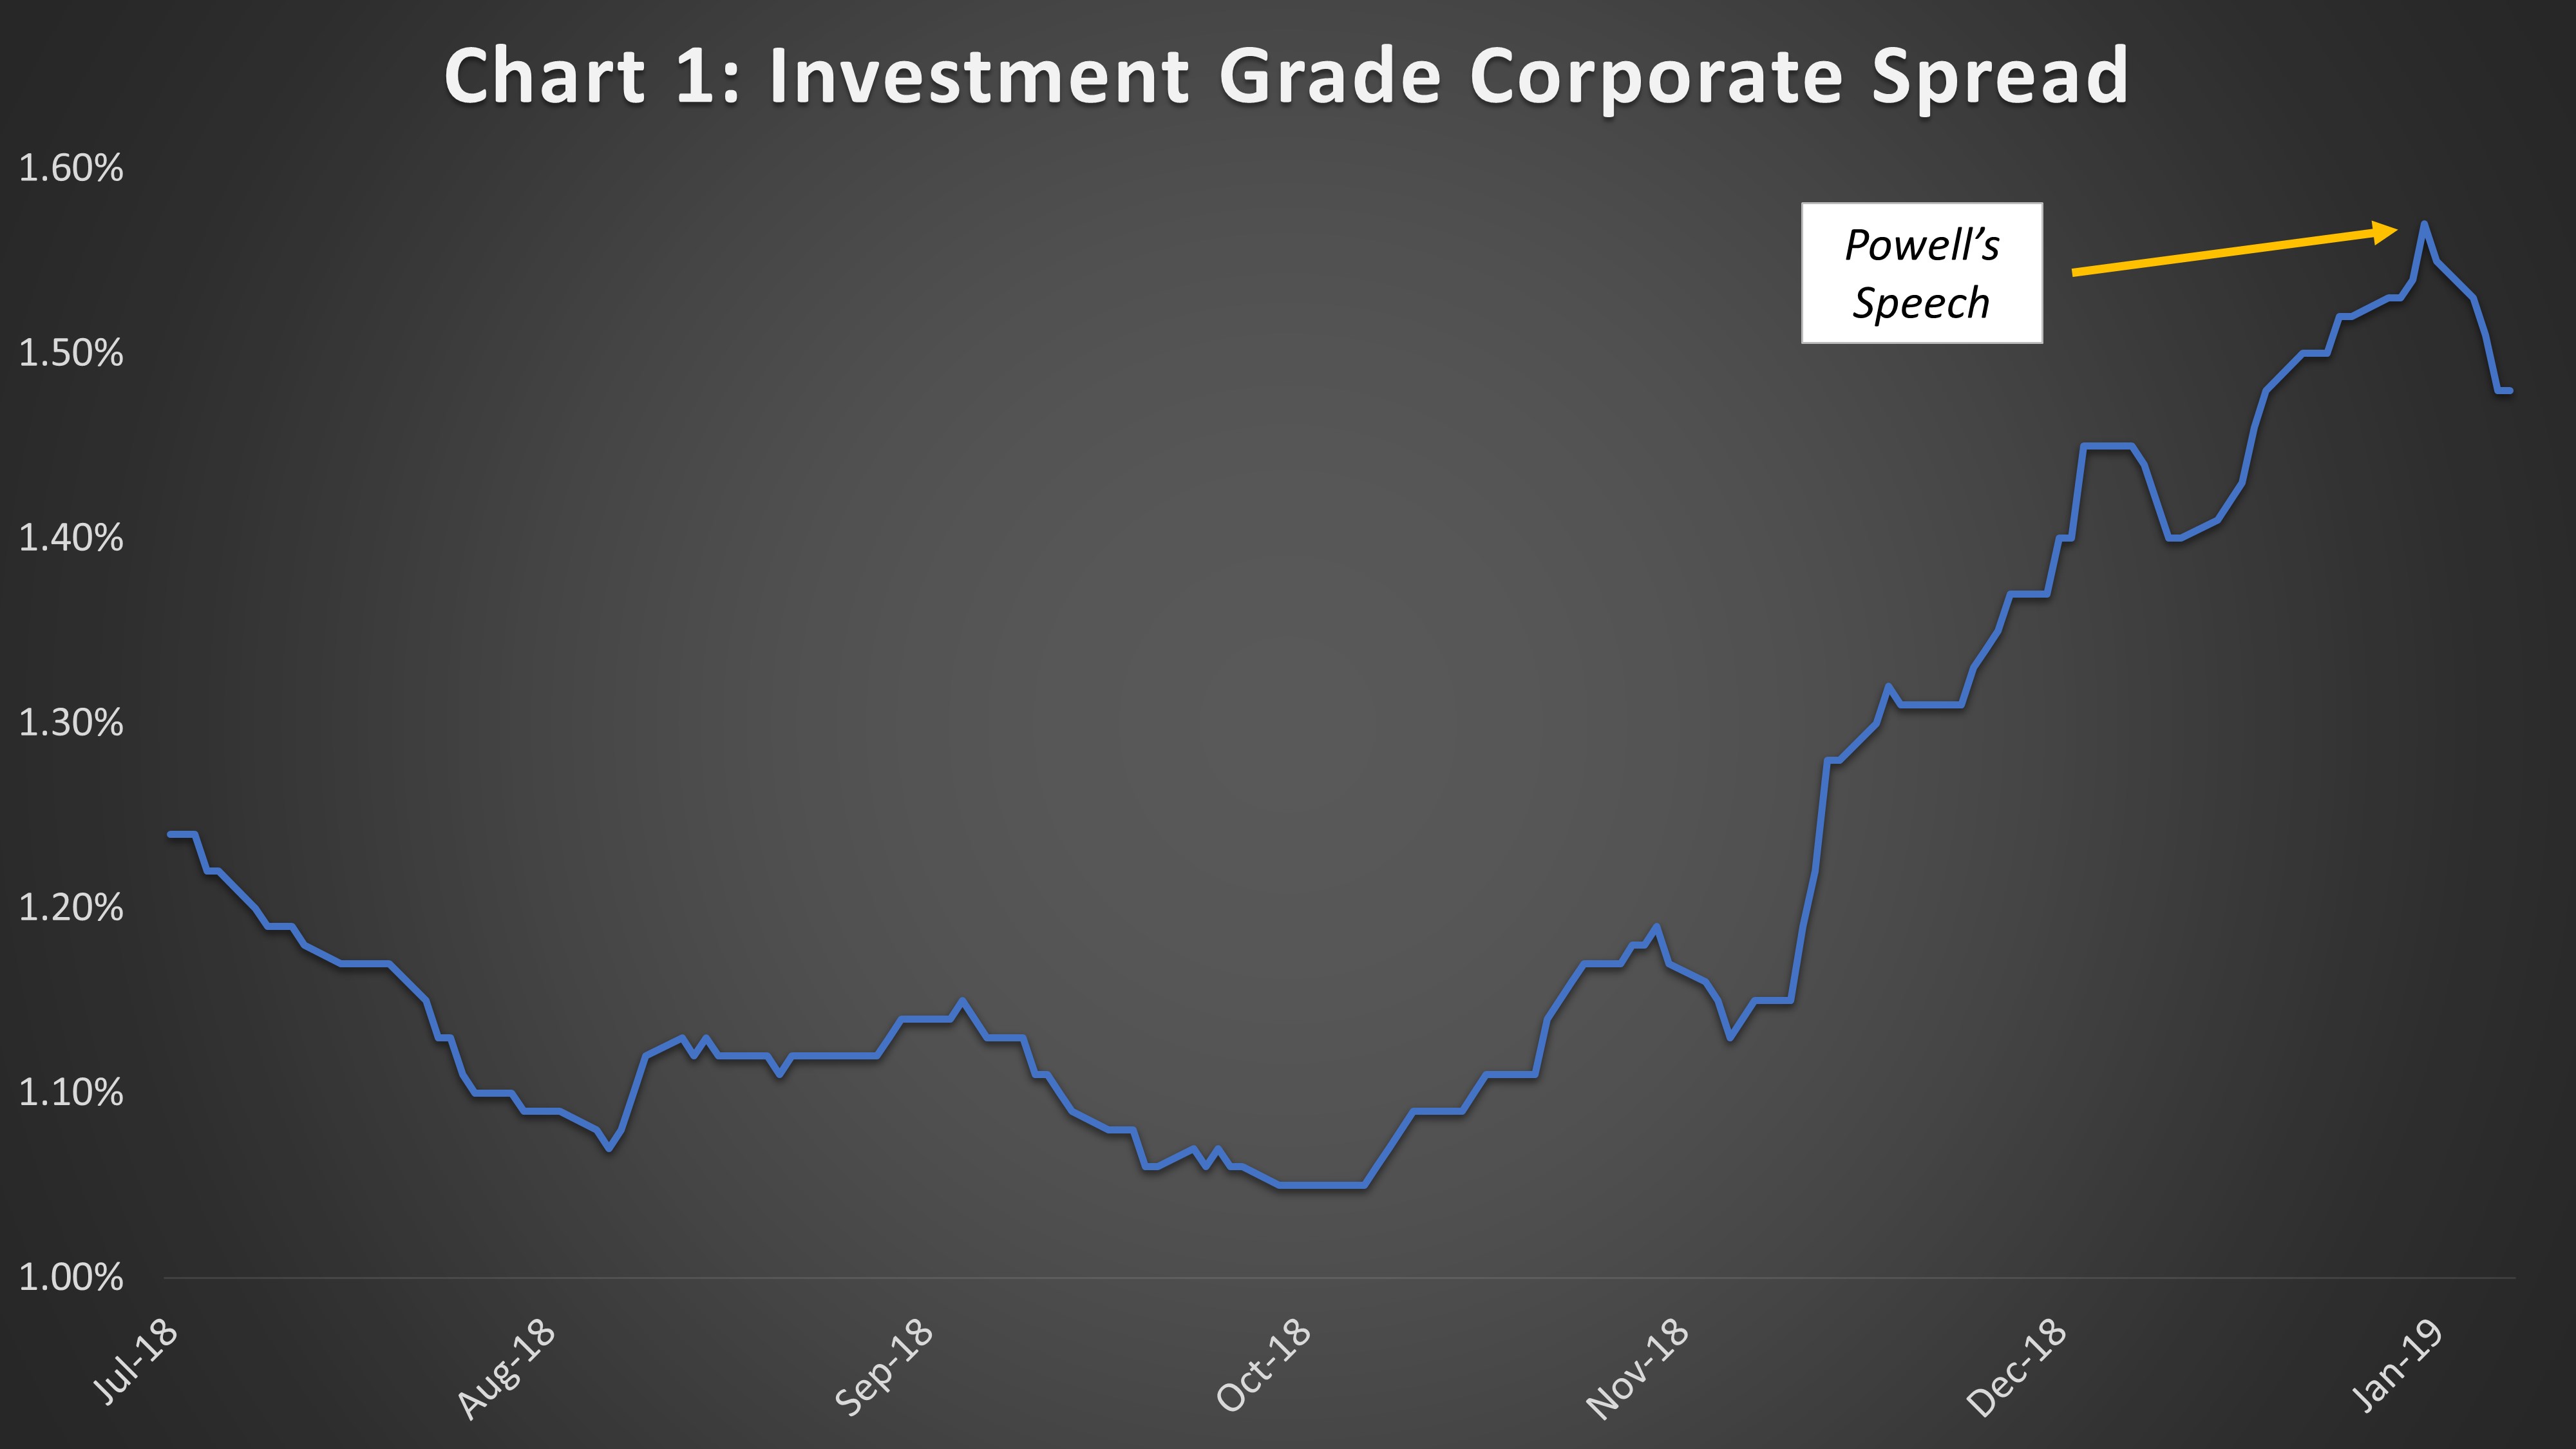
In his December press conference, Federal Reserve Chairman Jerome Powell dismissed market concerns over further interest rate hikes, roiling an already troubled equity market. The result was one of the worst months for risk assets in recent memory – the S&P 500 suffered the worst December since the Great Depression. Credit markets also experienced a massive negative turn in sentiment and price performance. Investment grade credit spreads closed the year at 153 basis points, nearly 50 basis points higher than the closing level on September 30.

Just a few weeks later, on January 4, Powell spoke on a panel with former Fed Chairs Janet Yellen and Ben Bernanke at the American Economic Association conference. His remarks reflected an about-face from his December press conference.

Notably, Powell stressed flexibility in Fed policy: “We’re always prepared to shift the stance of policy and to shift it significantly if necessary;” and, we’re: “Listening sensitively to the message that markets are sending;” and on the potential to pause its rate hike as well as balance sheet runoff, he said: “We will be prepared to adjust policy quickly and flexibly and to use all of our tools to support the economy.” The Fed then bolstered its messaging around a hiking pause this week when speeches from Fed officials Charles Evans, Loretta Meester, and Eric Rosengren echoed a similar tone.

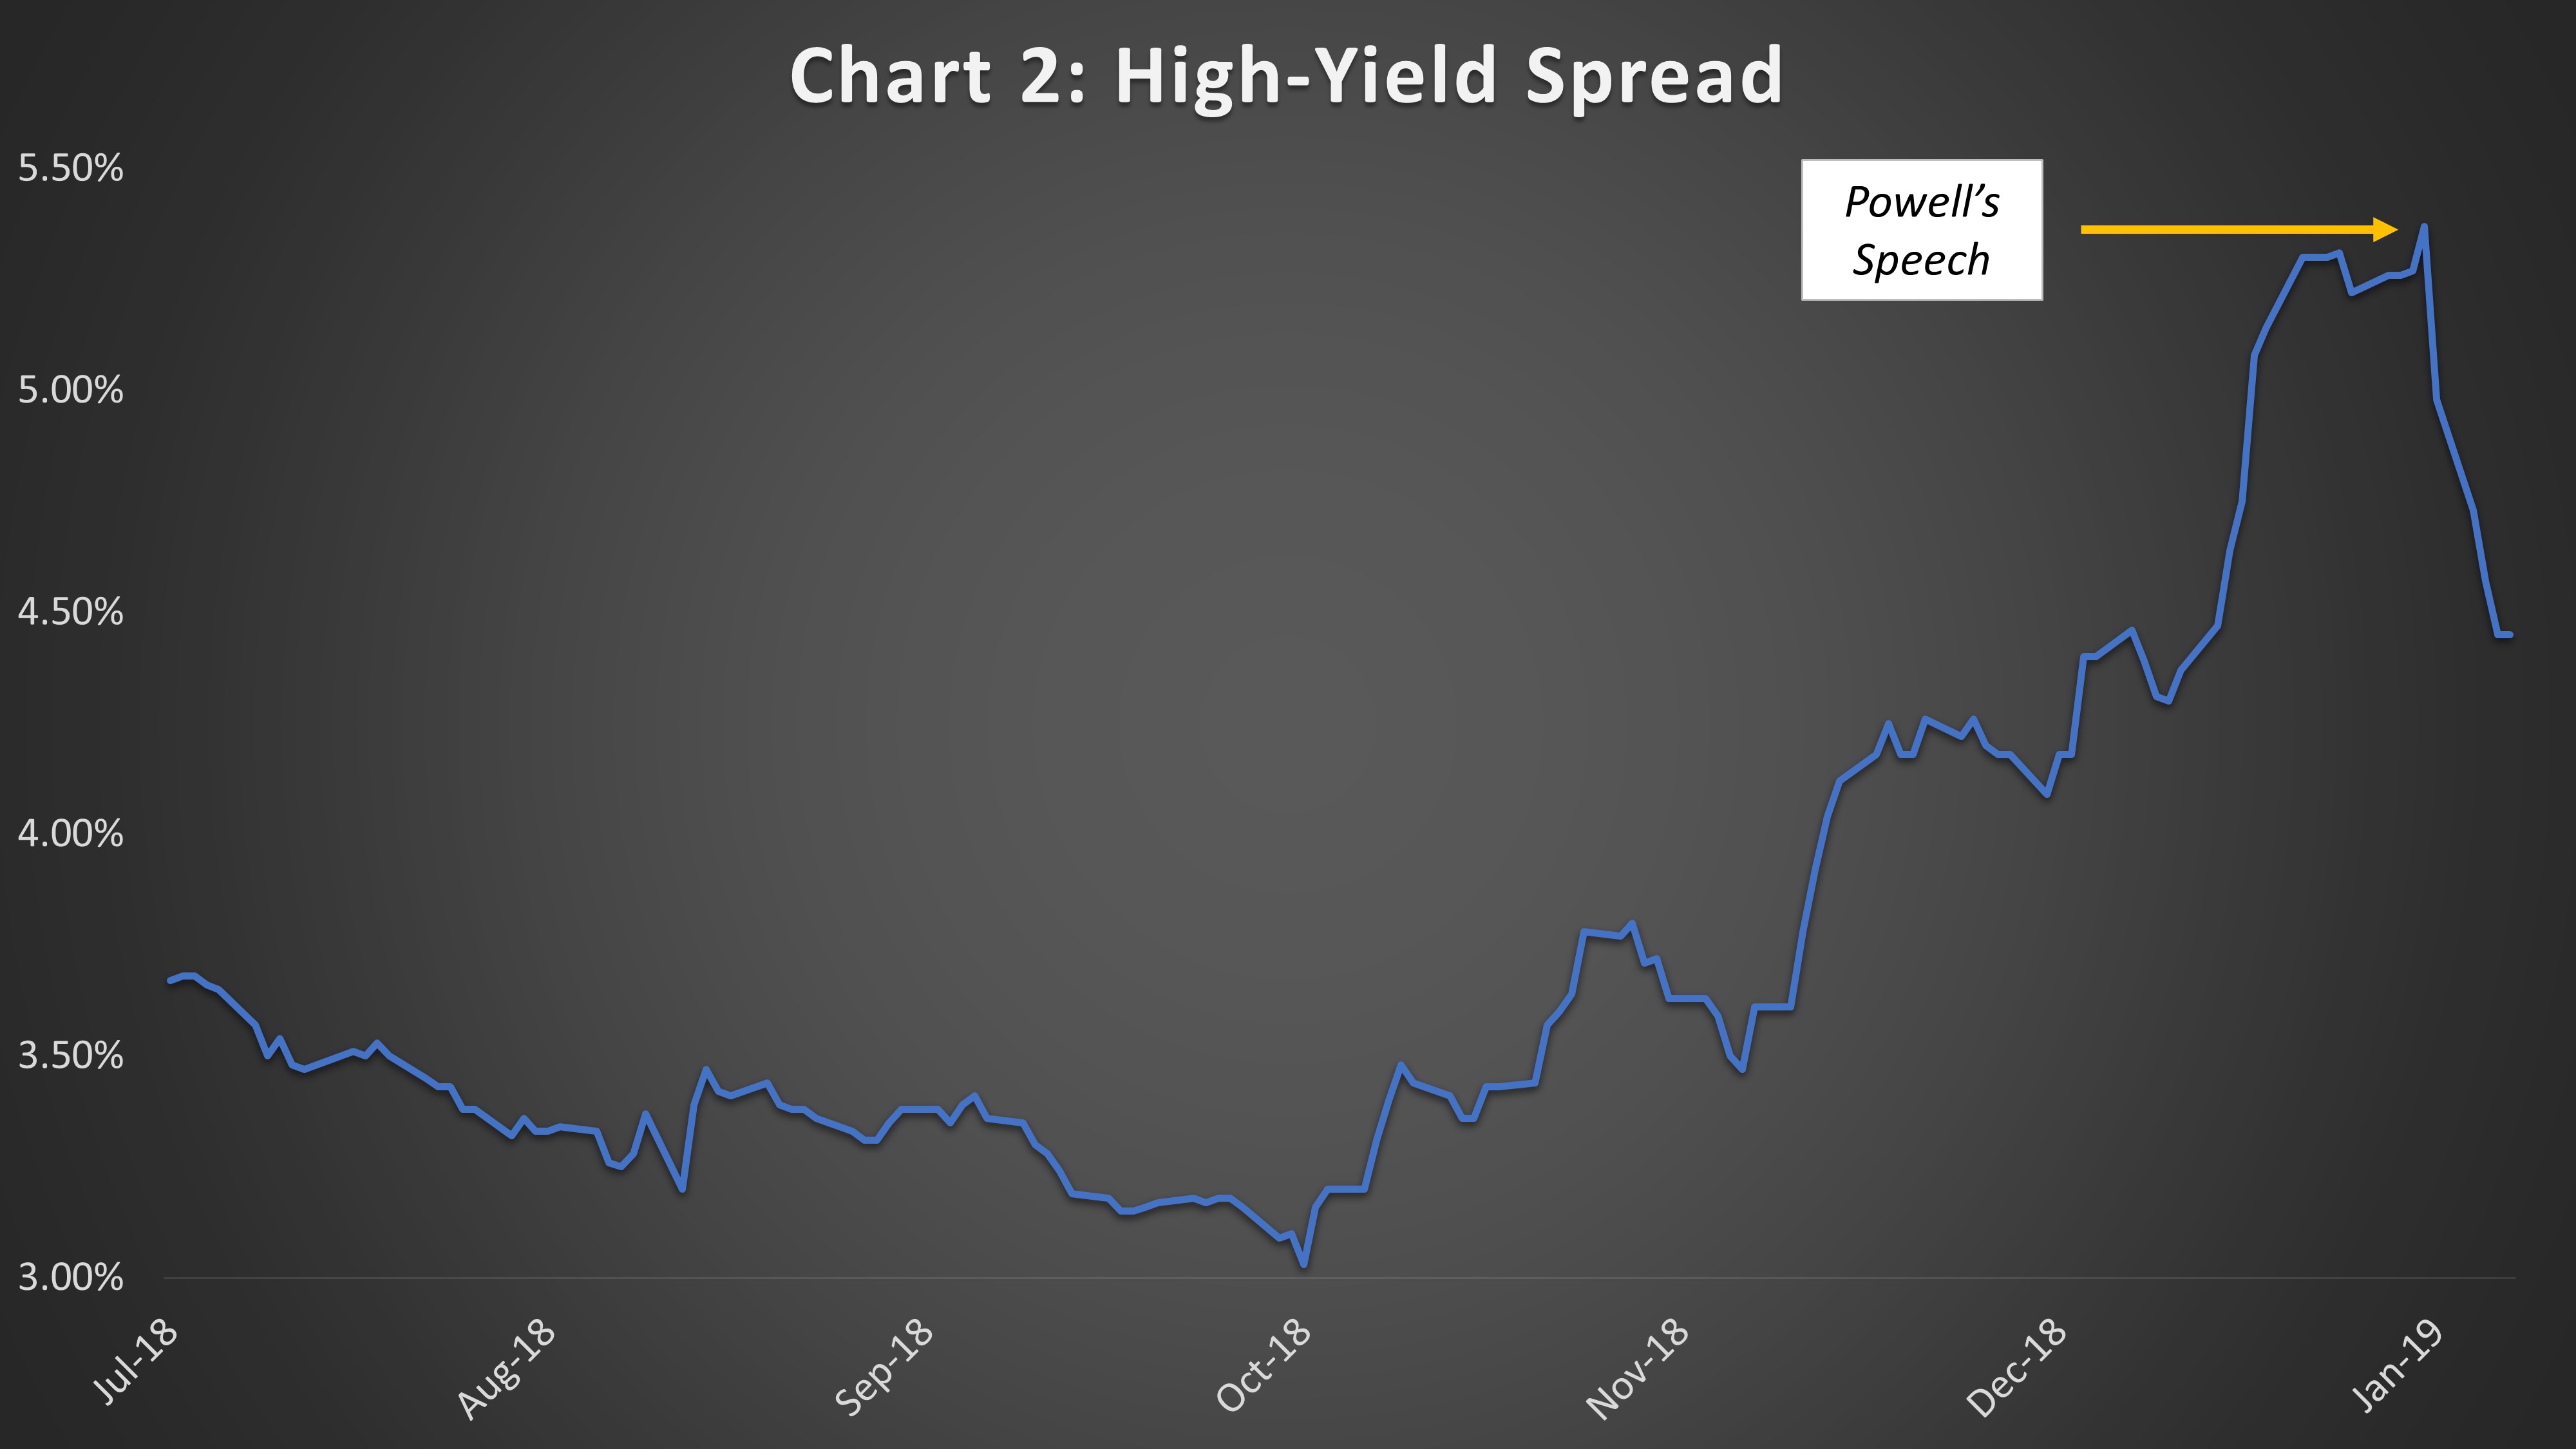
Financial stability and markets are now squarely and explicitly in the Fed’s crosshairs, and a dour market mood turned around on a dime. Credit markets have snapped back. Investment grade corporate spreads, which peaked on January 3, the day before Powell’s speech, have compressed by 9 basis points (Chart 1). More notably, high-yield credit spreads have fallen by 92 basis points, which retraces most of December’s move (Chart 2)!


Energy Leads the Charge Higher

The Energy sector has seen a particularly strong rebound in both spreads and sentiment, bolstered by a rebound in the benchmark West Texas Intermediate Crude Oil price from a low of $42.53 on December 24, 2018 to $52.02 on January 11, 2019.

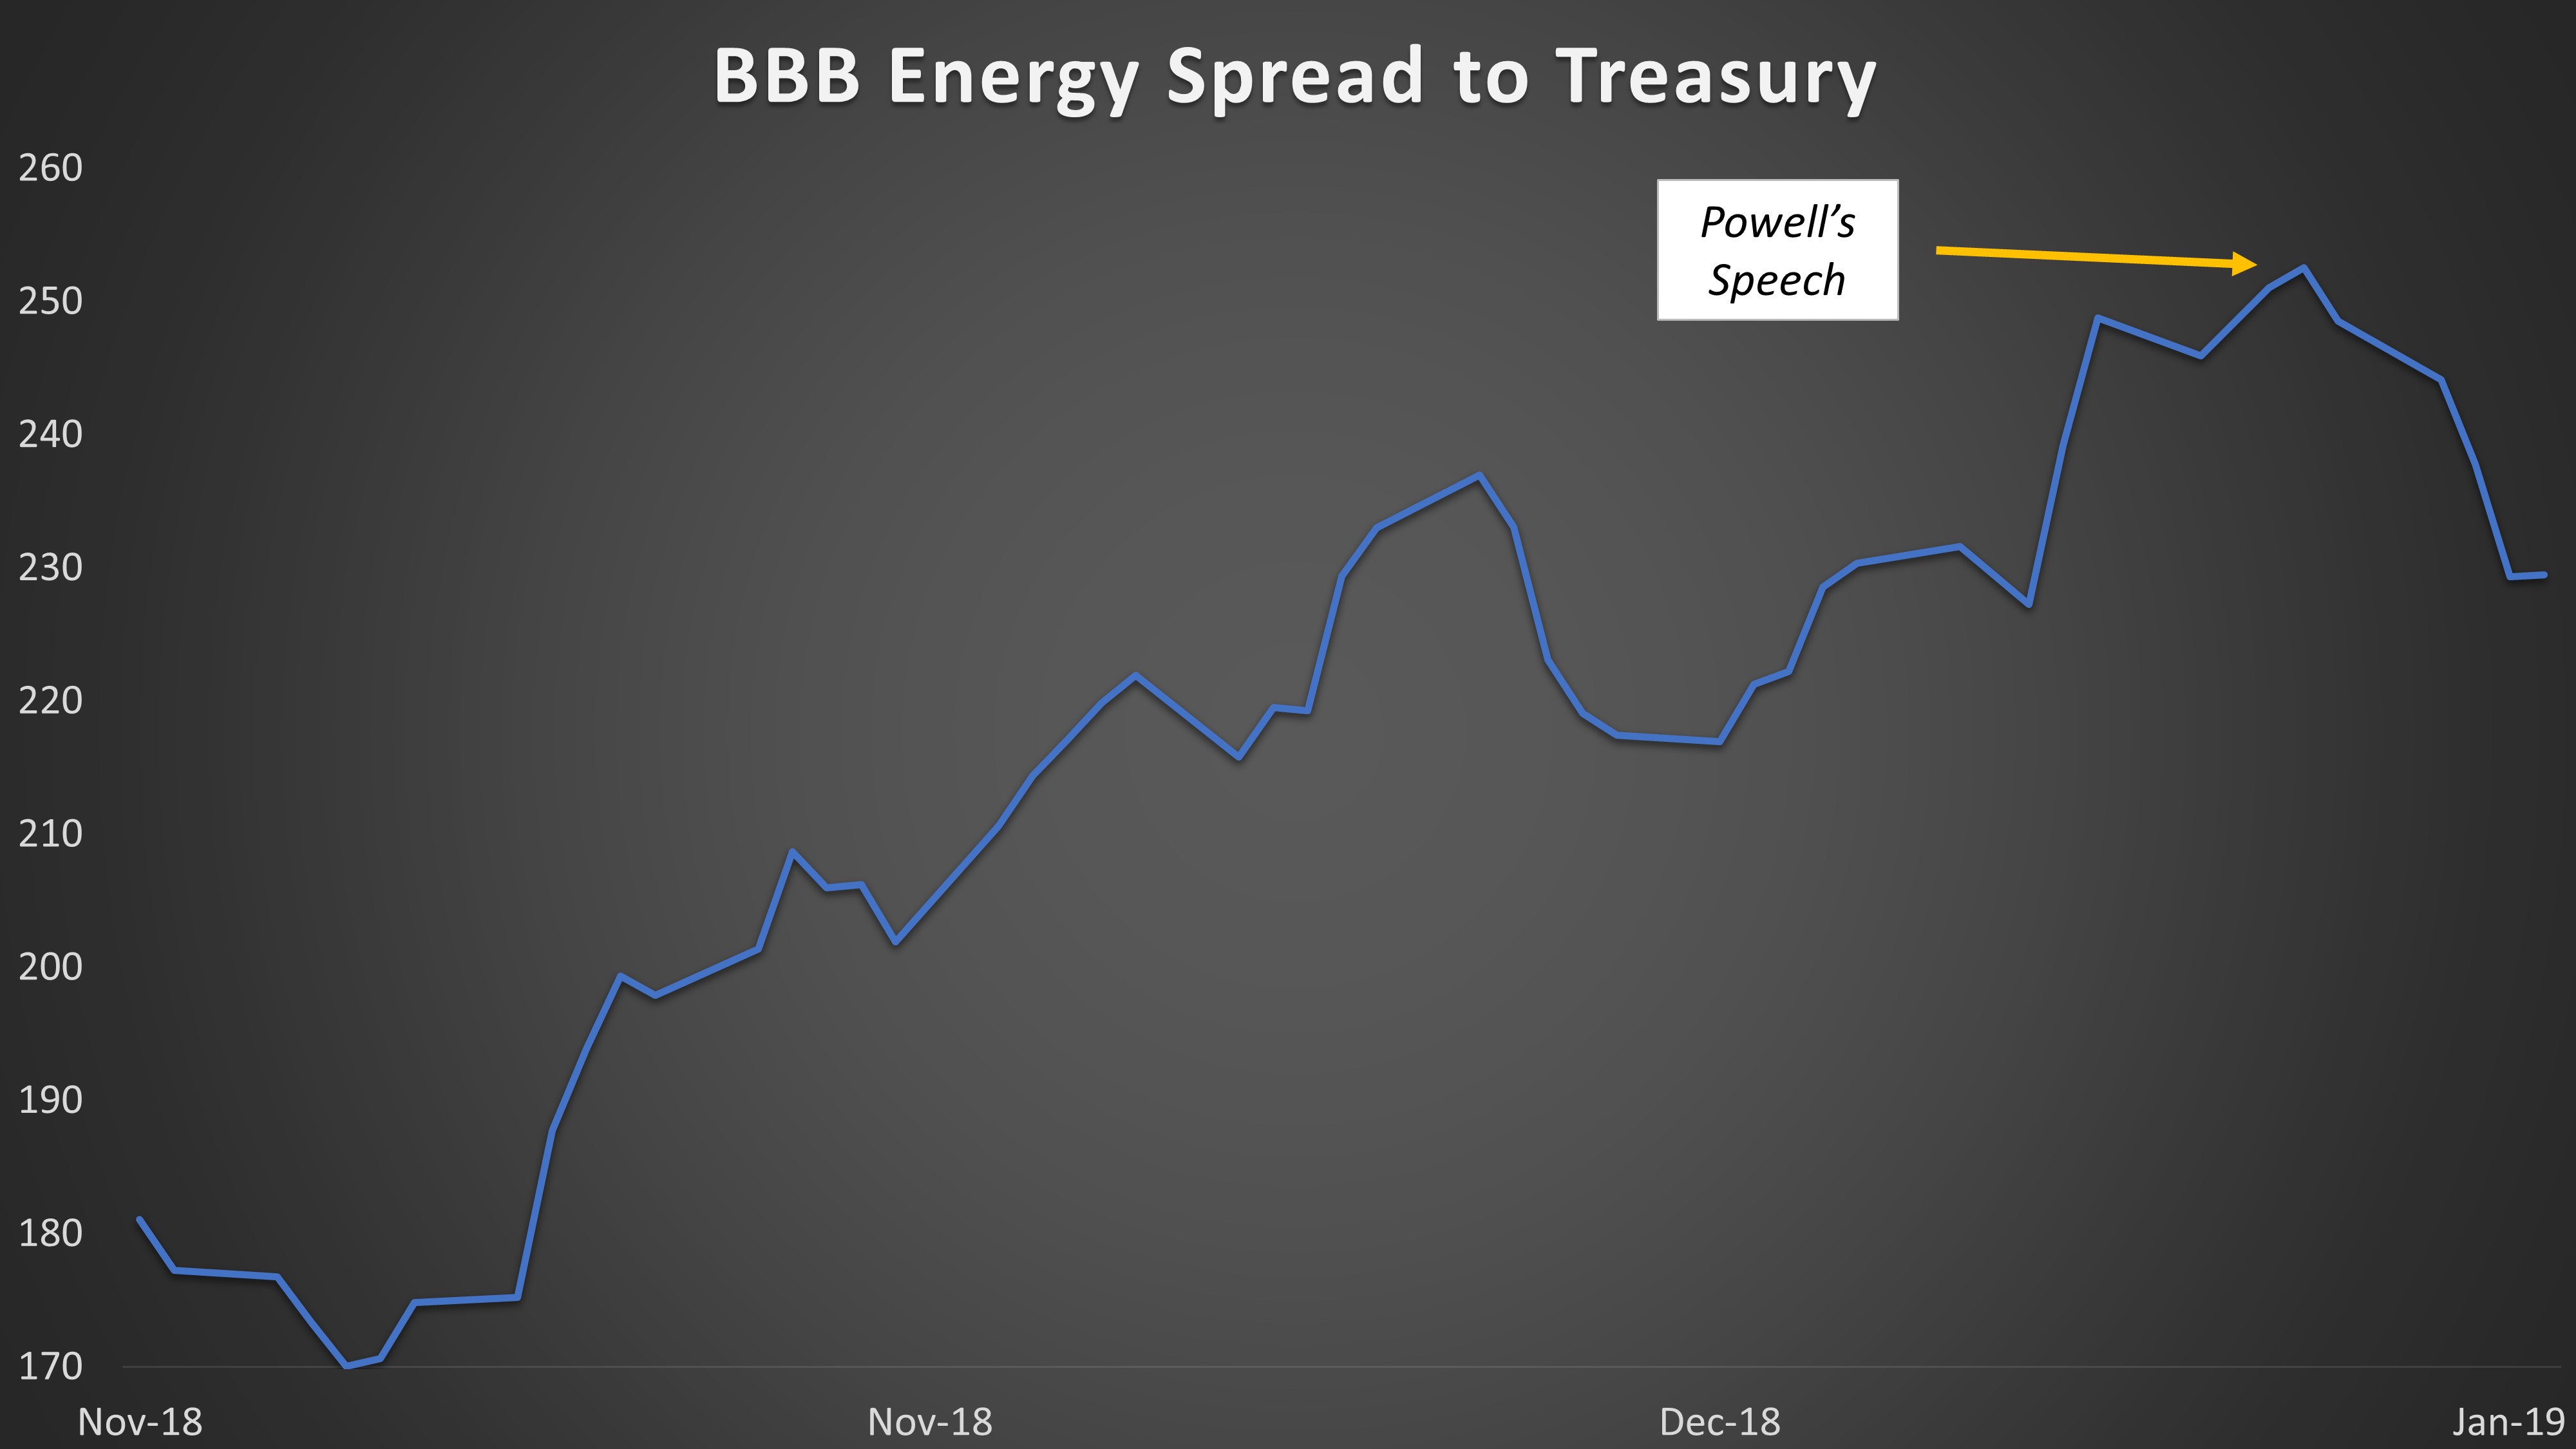
Energy sector BBB spreads compressed nearly 20 basis points following Powell’s comments, but perhaps the most notable development was the reopening of the high-yield new issue market by natural gas pipeline operator Targa Resources (NYSE: TRGP). Targa priced the first high-yield bond issuance this year, the first since December 11, 2018. Prior to this deal, the high-yield new issue market had been effectively closed for a month due to extremely poor sentiment surrounding risk assets.

It’s significant that the volatile Energy sector was the home of the first company to break the drought. So strong was the demand for this speculative new issue that Targa was able to garner $1.5 billion in bond proceeds, twice the planned initial amount. The new bonds have performed well thus far, trading 2 points higher and nearly 40 basis points tighter in spread since issuance.


It’s significant that the volatile Energy sector was the home of the first company to break the drought. The fact that an energy company had a successful issuance speaks volumes of where sentiment is headed. It also confirms the idea that expectations for global demand growth are perhaps turning more positive.


Disclosures: This is for informational purposes only and is not intended as investment advice or an offer or solicitation with respect to the purchase or sale of any security, strategy or investment product. Although the statements of fact, information, charts, analysis and data in this report have been obtained from, and are based upon, sources Sage believes to be reliable, we do not guarantee their accuracy, and the underlying information, data, figures and publicly available information has not been verified or audited for accuracy or completeness by Sage. Additionally, we do not represent that the information, data, analysis and charts are accurate or complete, and as such should not be relied upon as such. All results included in this report constitute Sage’s opinions as of the date of this report and are subject to change without notice due to various factors, such as market conditions. Investors should make their own decisions on investment strategies based on their specific investment objectives and financial circumstances. All investments contain risk and may lose value. Past performance is not a guarantee of future results.

Sage Advisory Services, Ltd. Co. is a registered investment adviser that provides investment management services for a variety of institutions and high net worth individuals. For additional information on Sage and its investment management services, please view our web site at www.sageadvisory.com, or refer to our Form ADV, which is available upon request by calling 512.327.5530.
5 Reasons to Favor Core Fixed Income in 2019

  1. Higher Volatility. Even after factoring in some spread widening during the year, Sage believes 3% to 4% return is easily achievable for core fixed income. And with equity return expectations below average, in the 5%-to-6% range, and accompanied by greater downside risks and high volatility, fixed income is the more attractive asset class from a risk-reward perspective going into the new year.


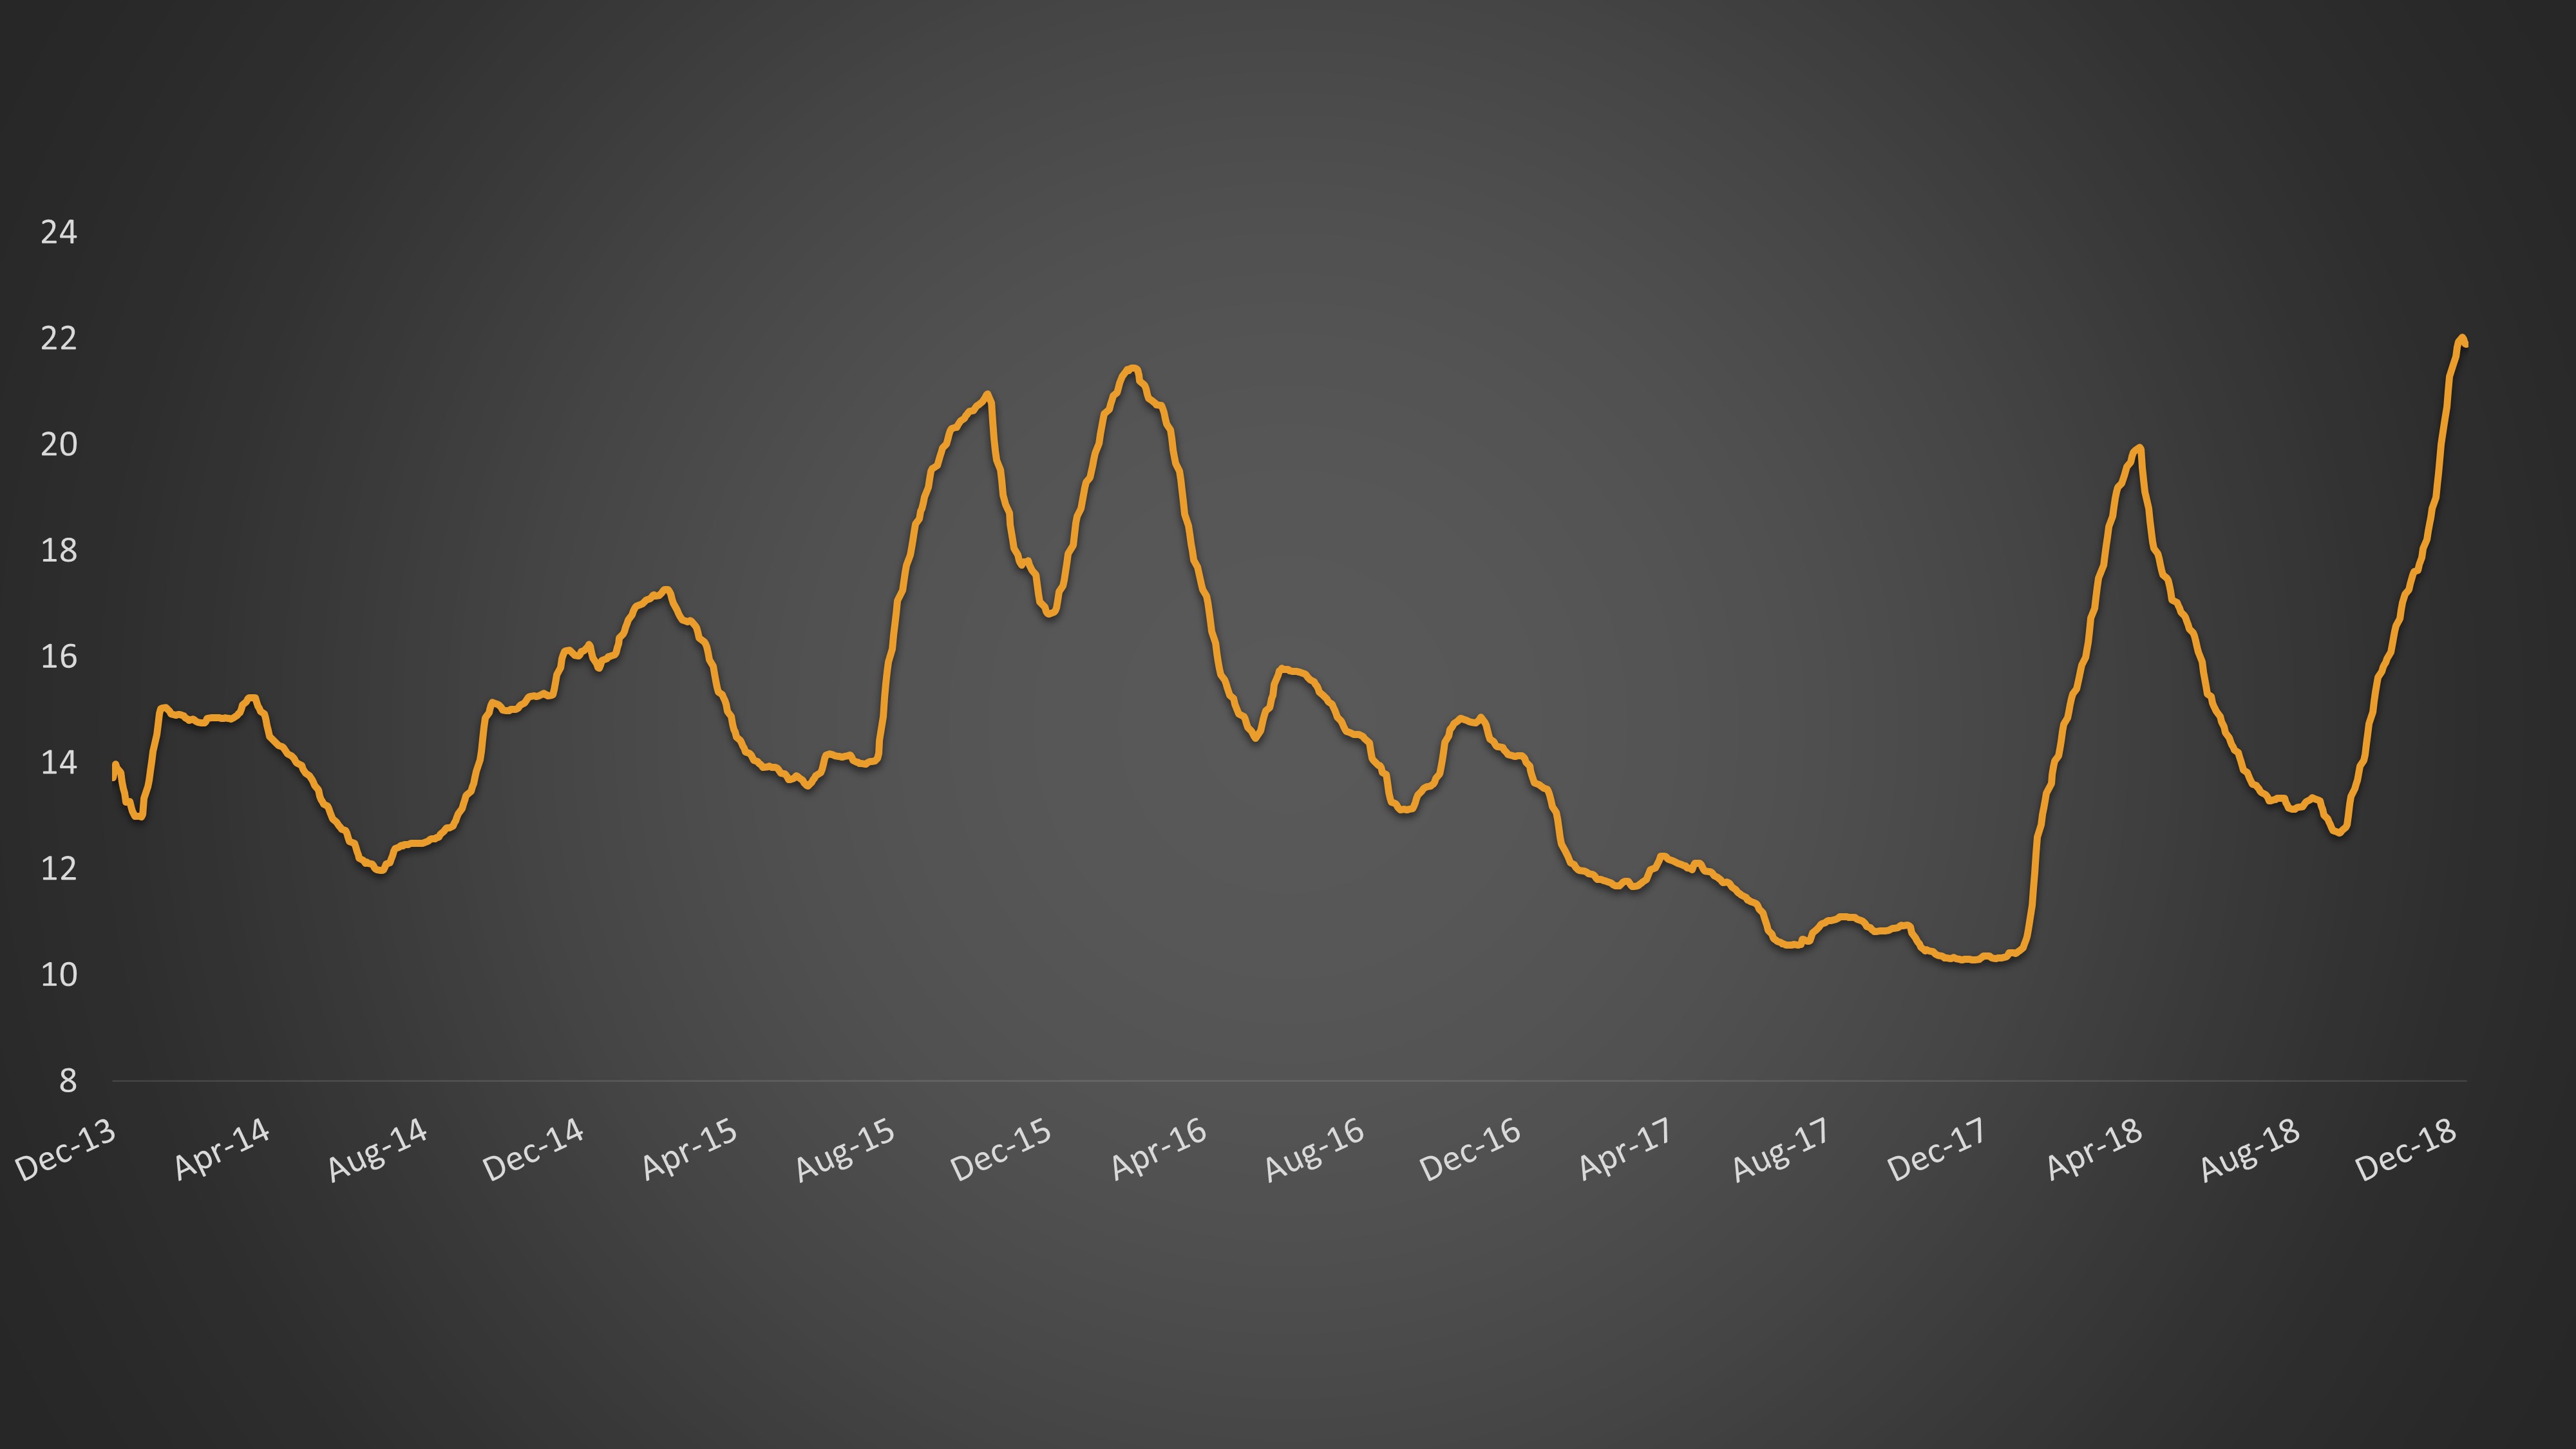
Equity Volatility (VIX) 3-Month Average


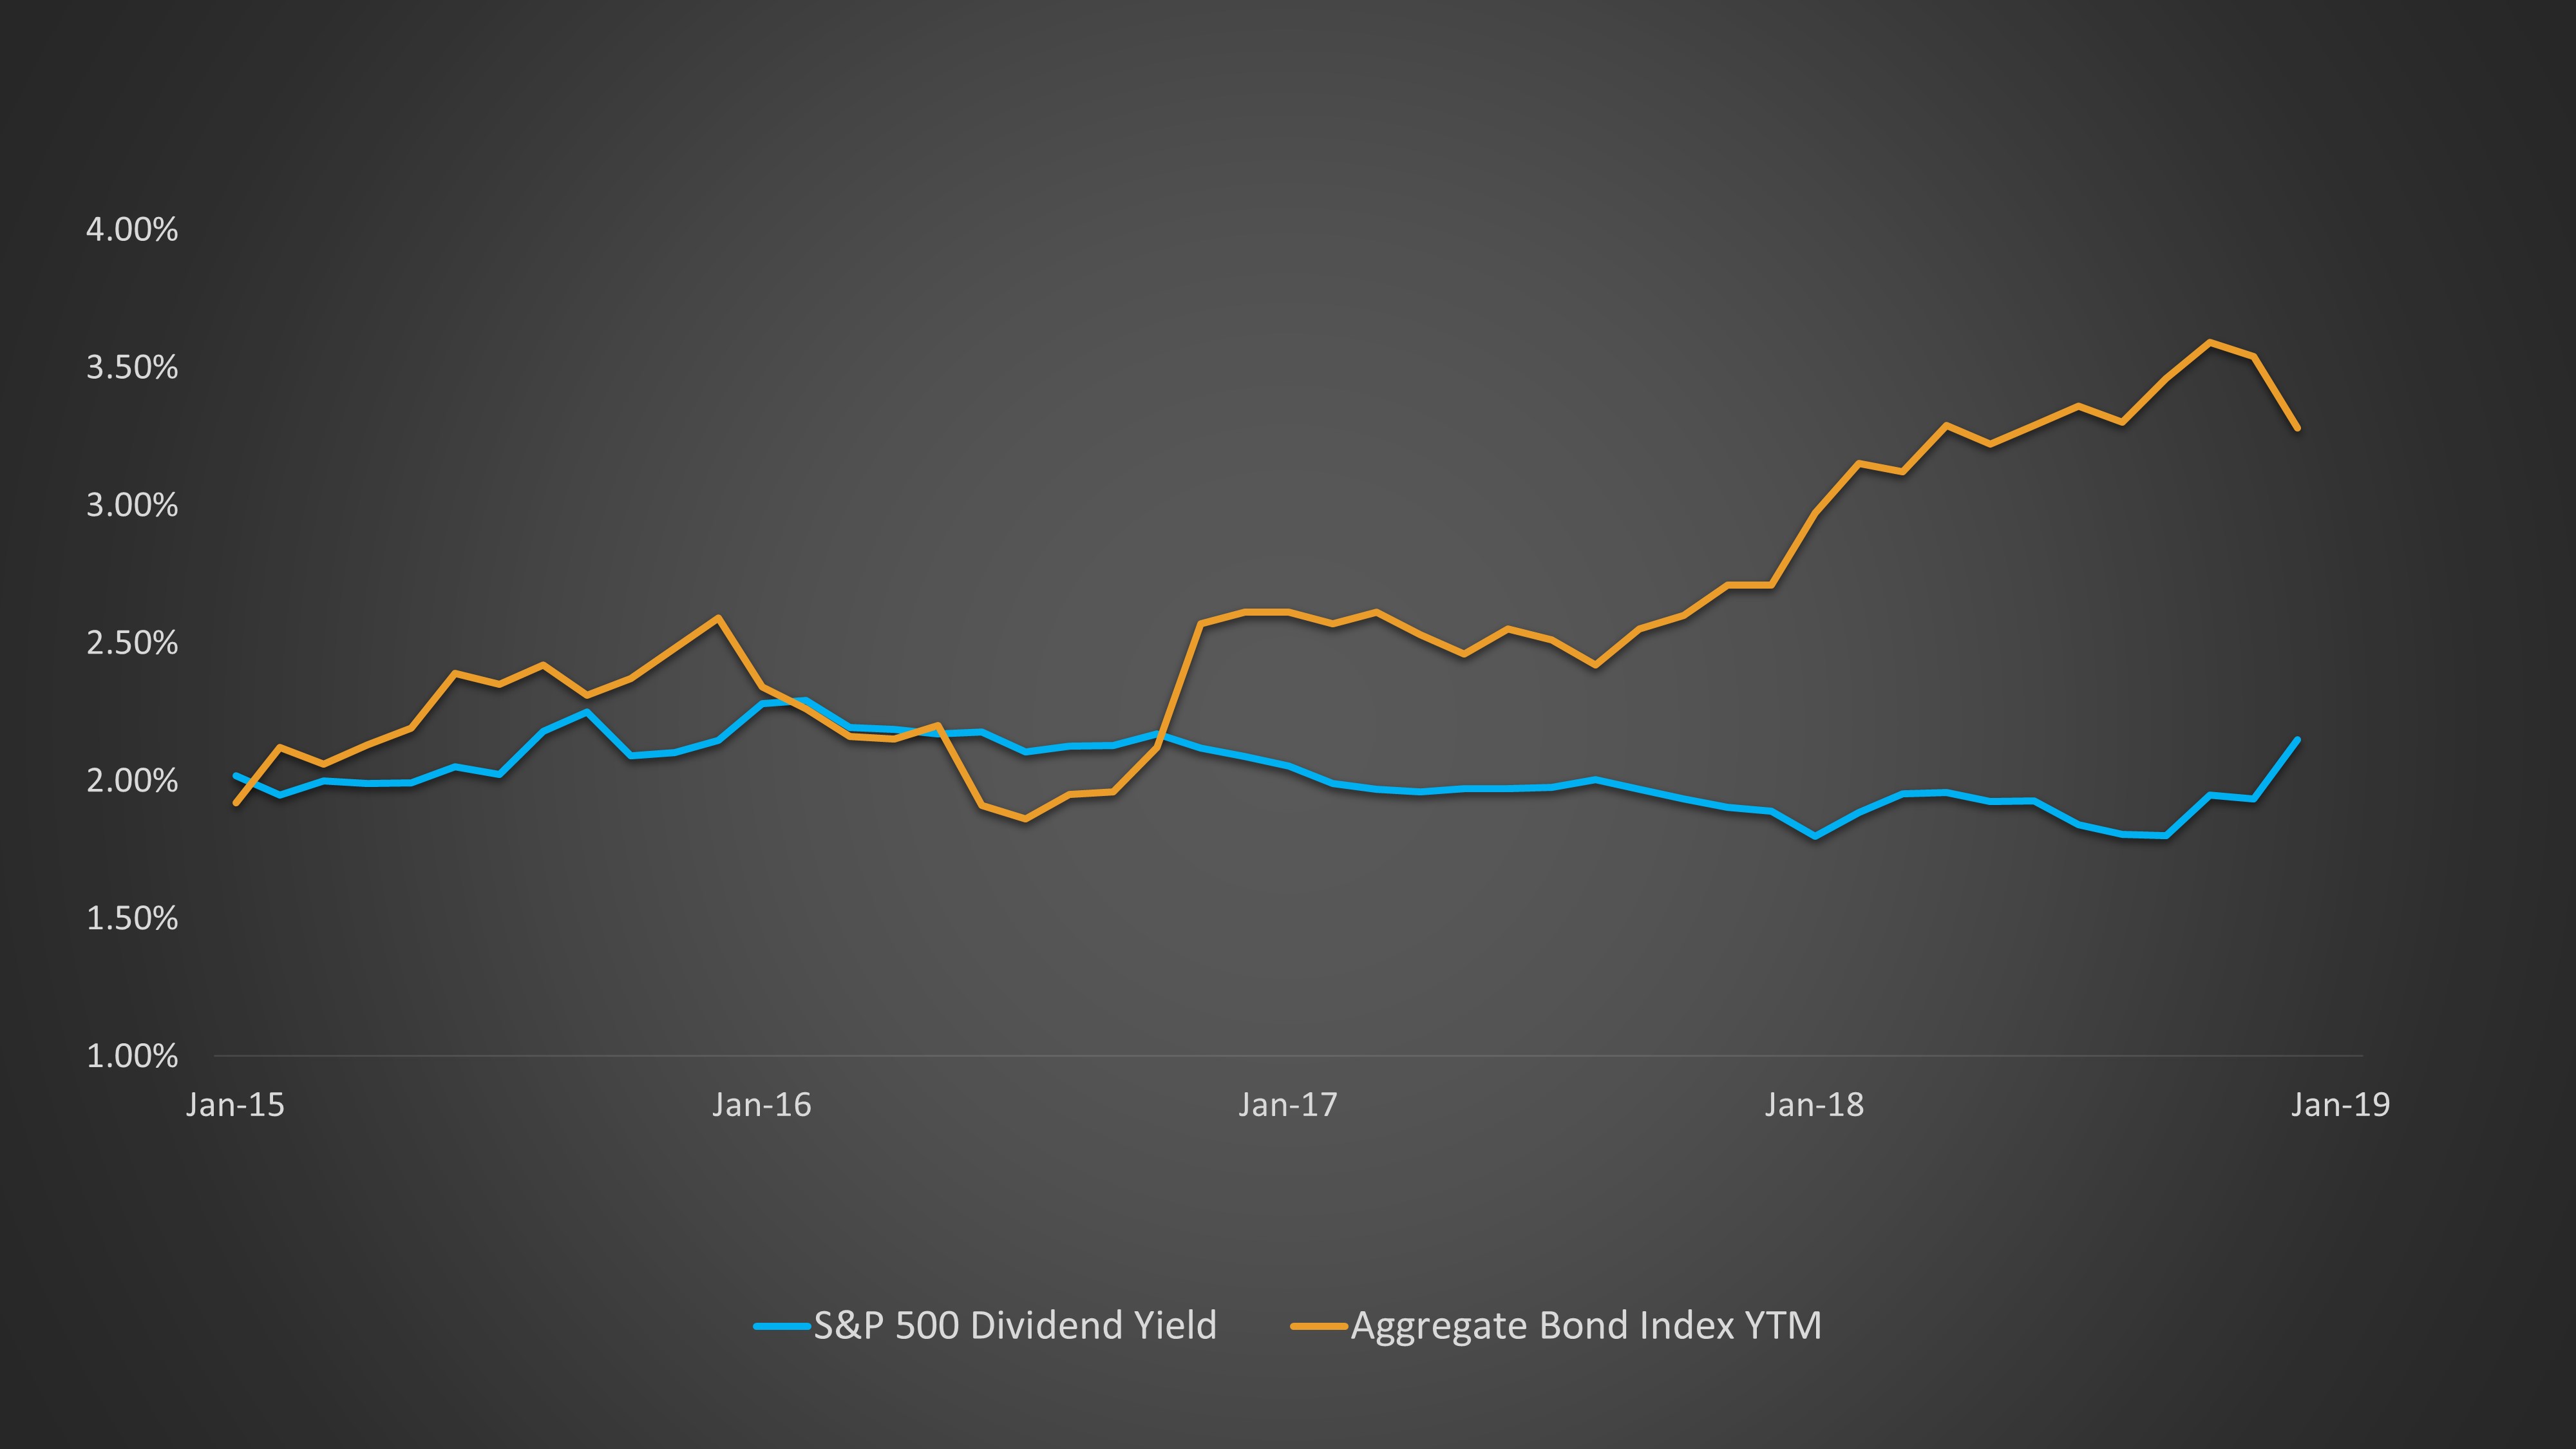
  1. Higher Yields. For income seekers, yields on diversified core investment grade fixed income are now 3.25%, up 60% from just three years ago, and are now well above equity dividend yields. This should add some stability to returns. For more risk-averse investors, with the curve flattening, short-duration strategies now offer attractive yield with limited interest rate risk.


Core Bond and Equity Yields

          Source: Bloomberg


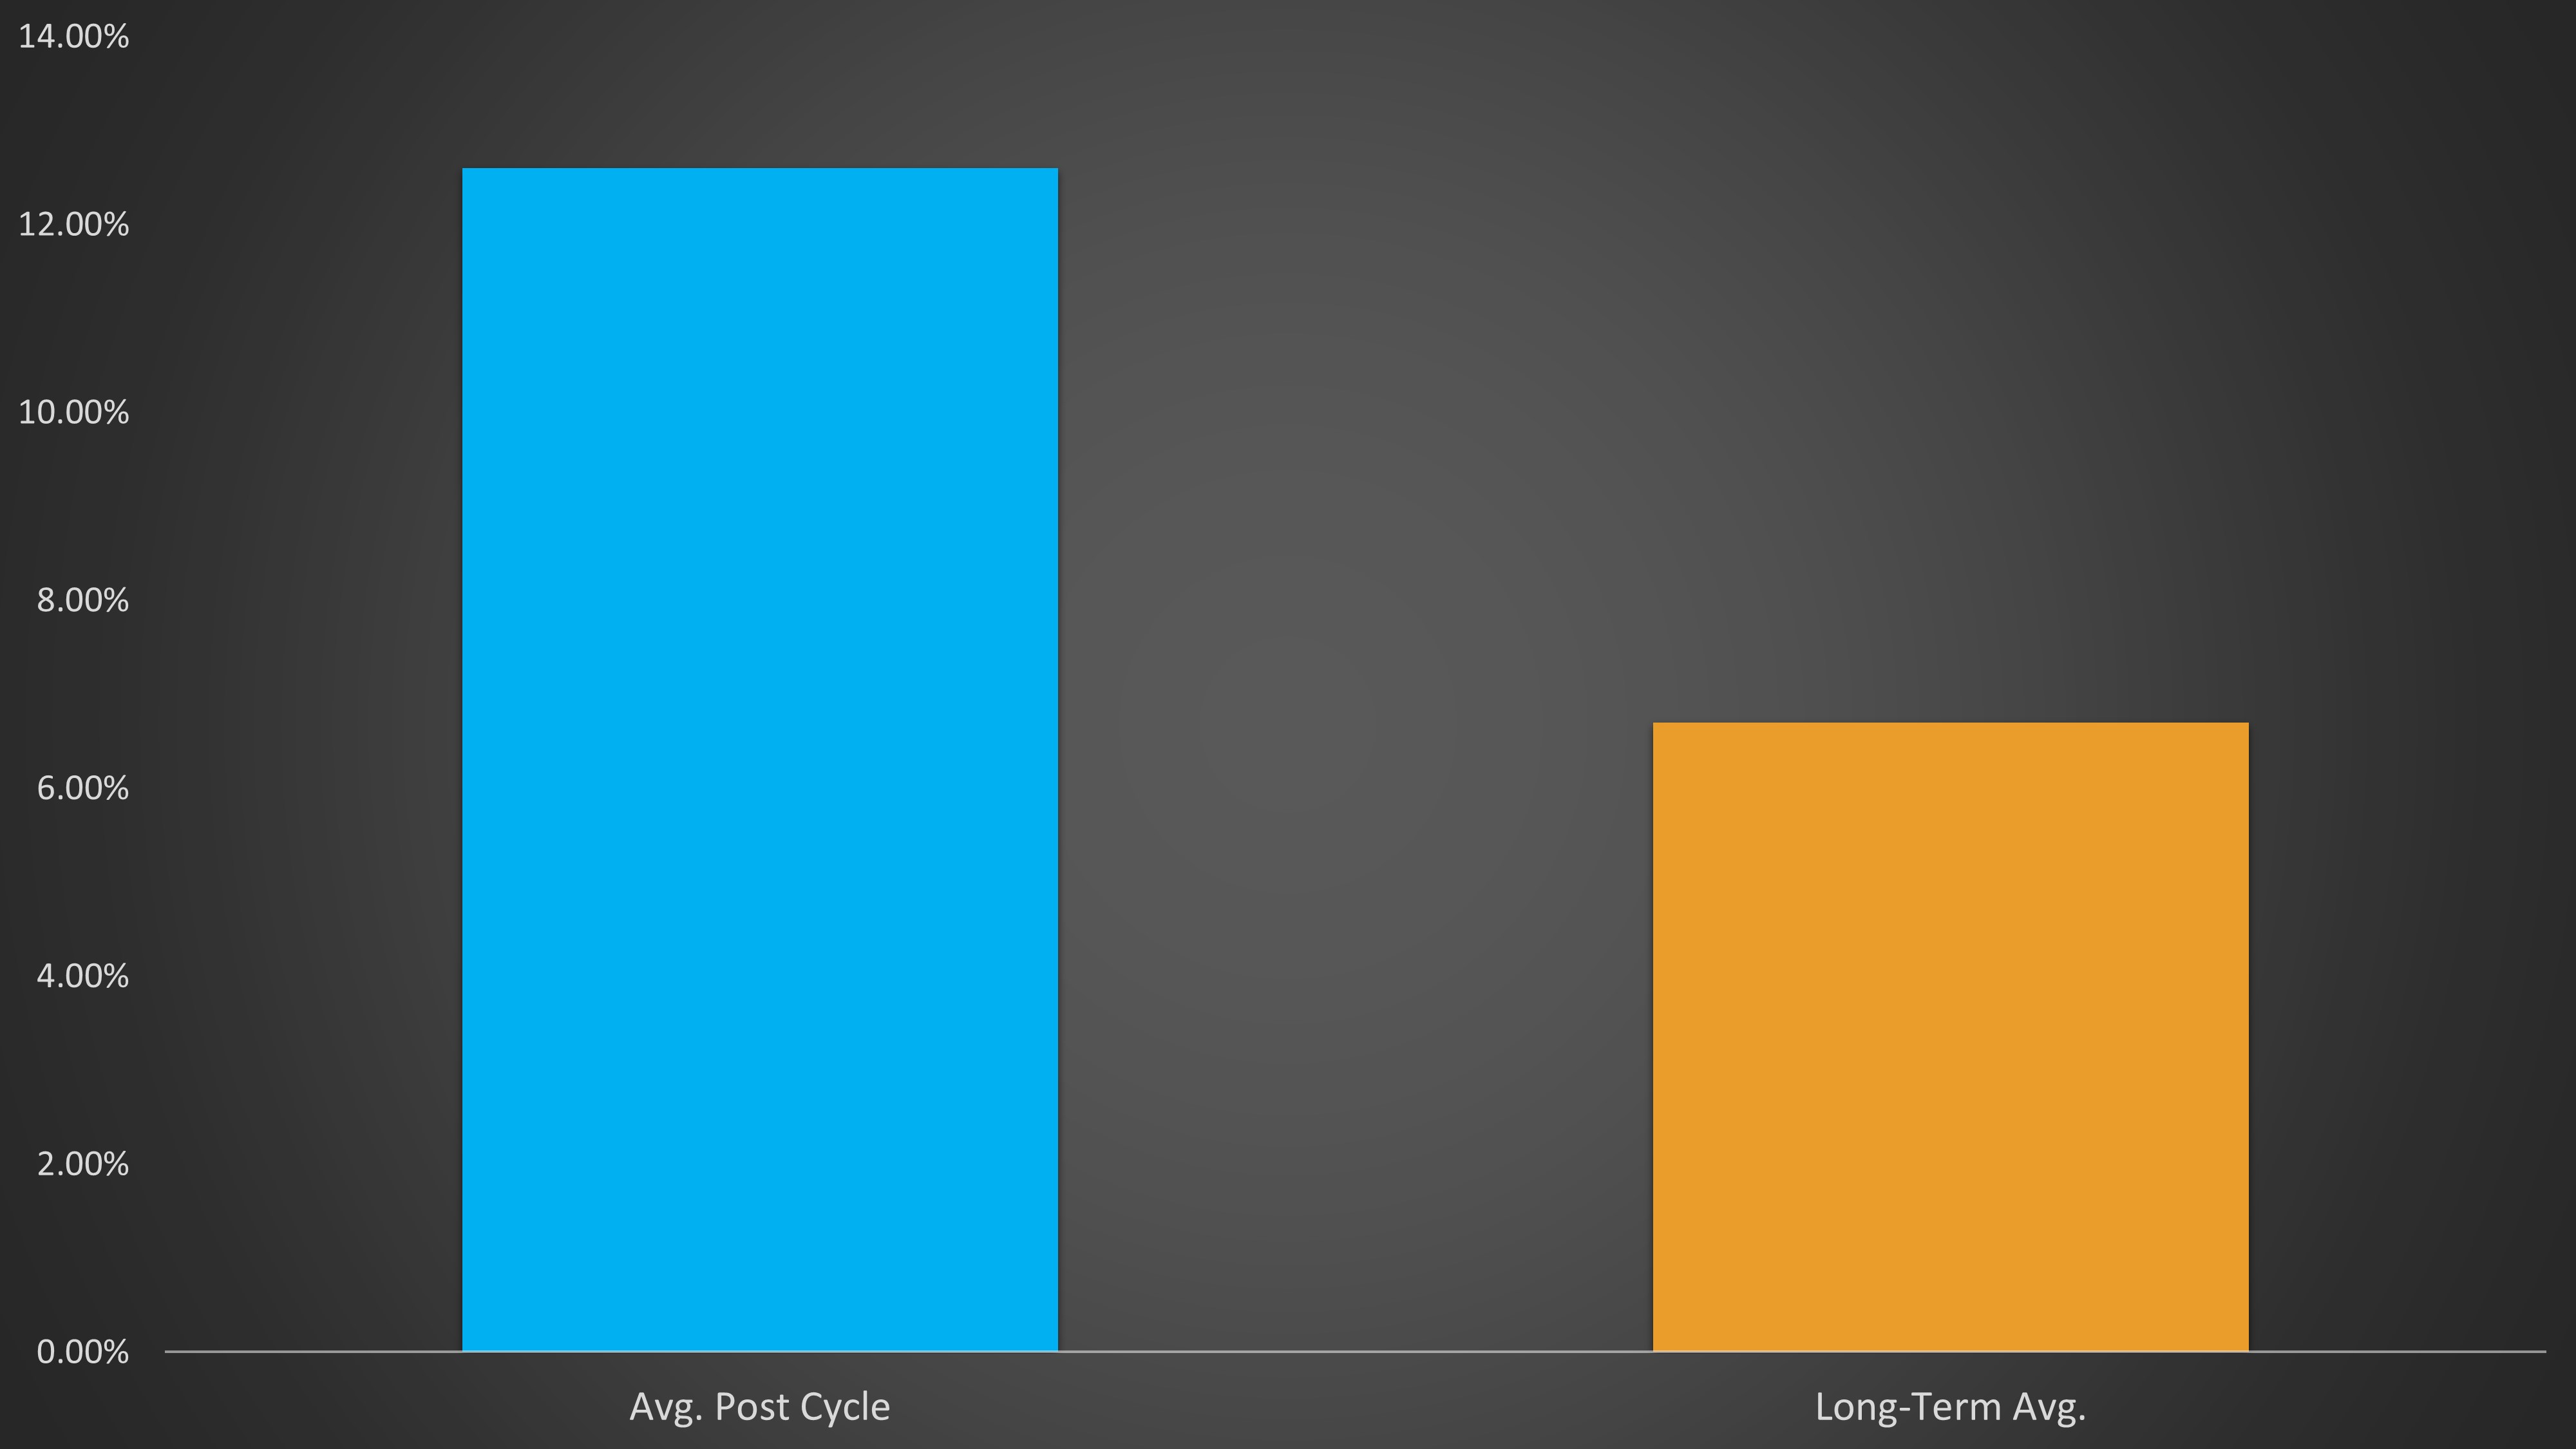
  1. The End of the Fed cycle. Unlike equities, which experienced a deteriorating picture into year end, bond investors enjoyed improving returns throughout the year, with the Aggregate Index posting better returns each subsequent quarter. This is not an unusual pattern, as bond returns are typically higher into the end of a Fed cycle, as investors reap the benefits of higher yields and long rates stabilize in anticipation. The environment improves further for bond investors post-Fed cycle, with returns for the 12 months following the end of a Fed cycle almost double the longer-term average.


Core IG Bond Returns: Long-Term vs. Post-Fed Cycle 

          Source: Bloomberg. Average post-cycle includes the last six Fed cycles, and long-term average is since 1985.


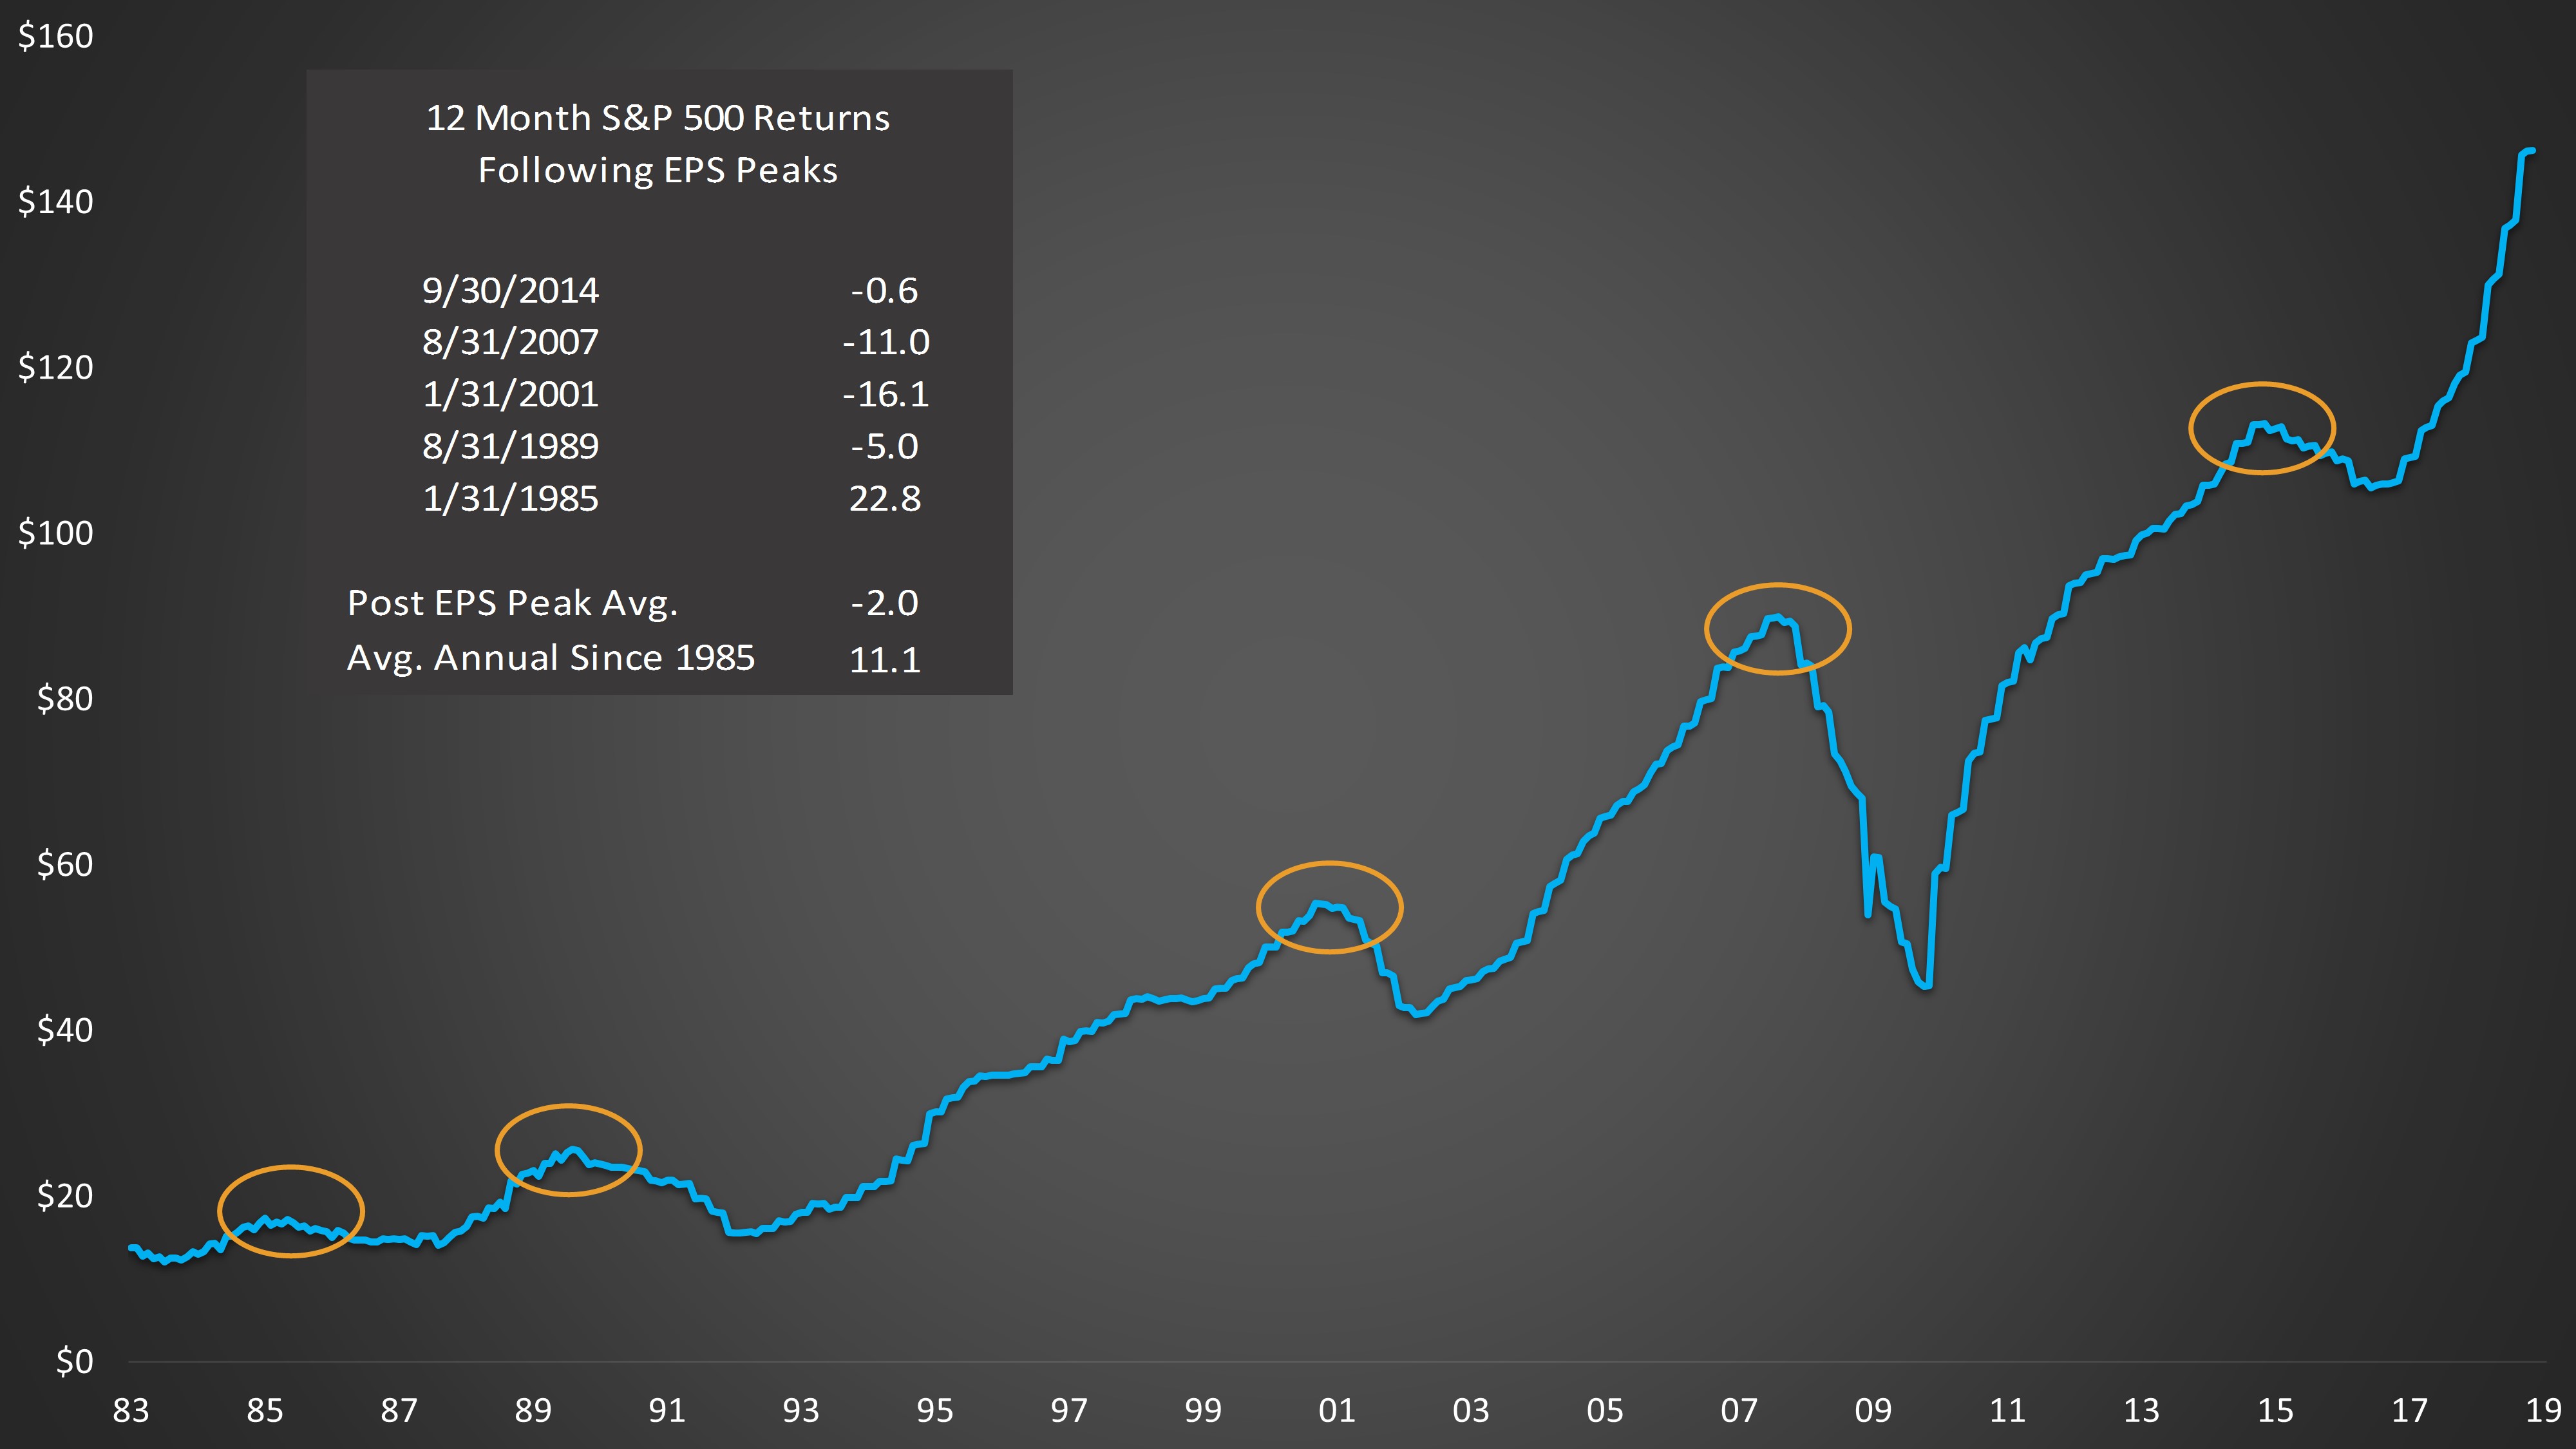
  1. Equity Headwinds/Earnings Peak. Equities face greater macro headwinds relative to bonds at this point in the form of decelerating global growth and earnings, tightening liquidity from central banks, and a host of geopolitical tail risks. If earnings have indeed peaked for the cycle, the rollover process has not historically been pleasant for equity investors.


S&P 500 12-Month EPS

          Source: Bloomberg


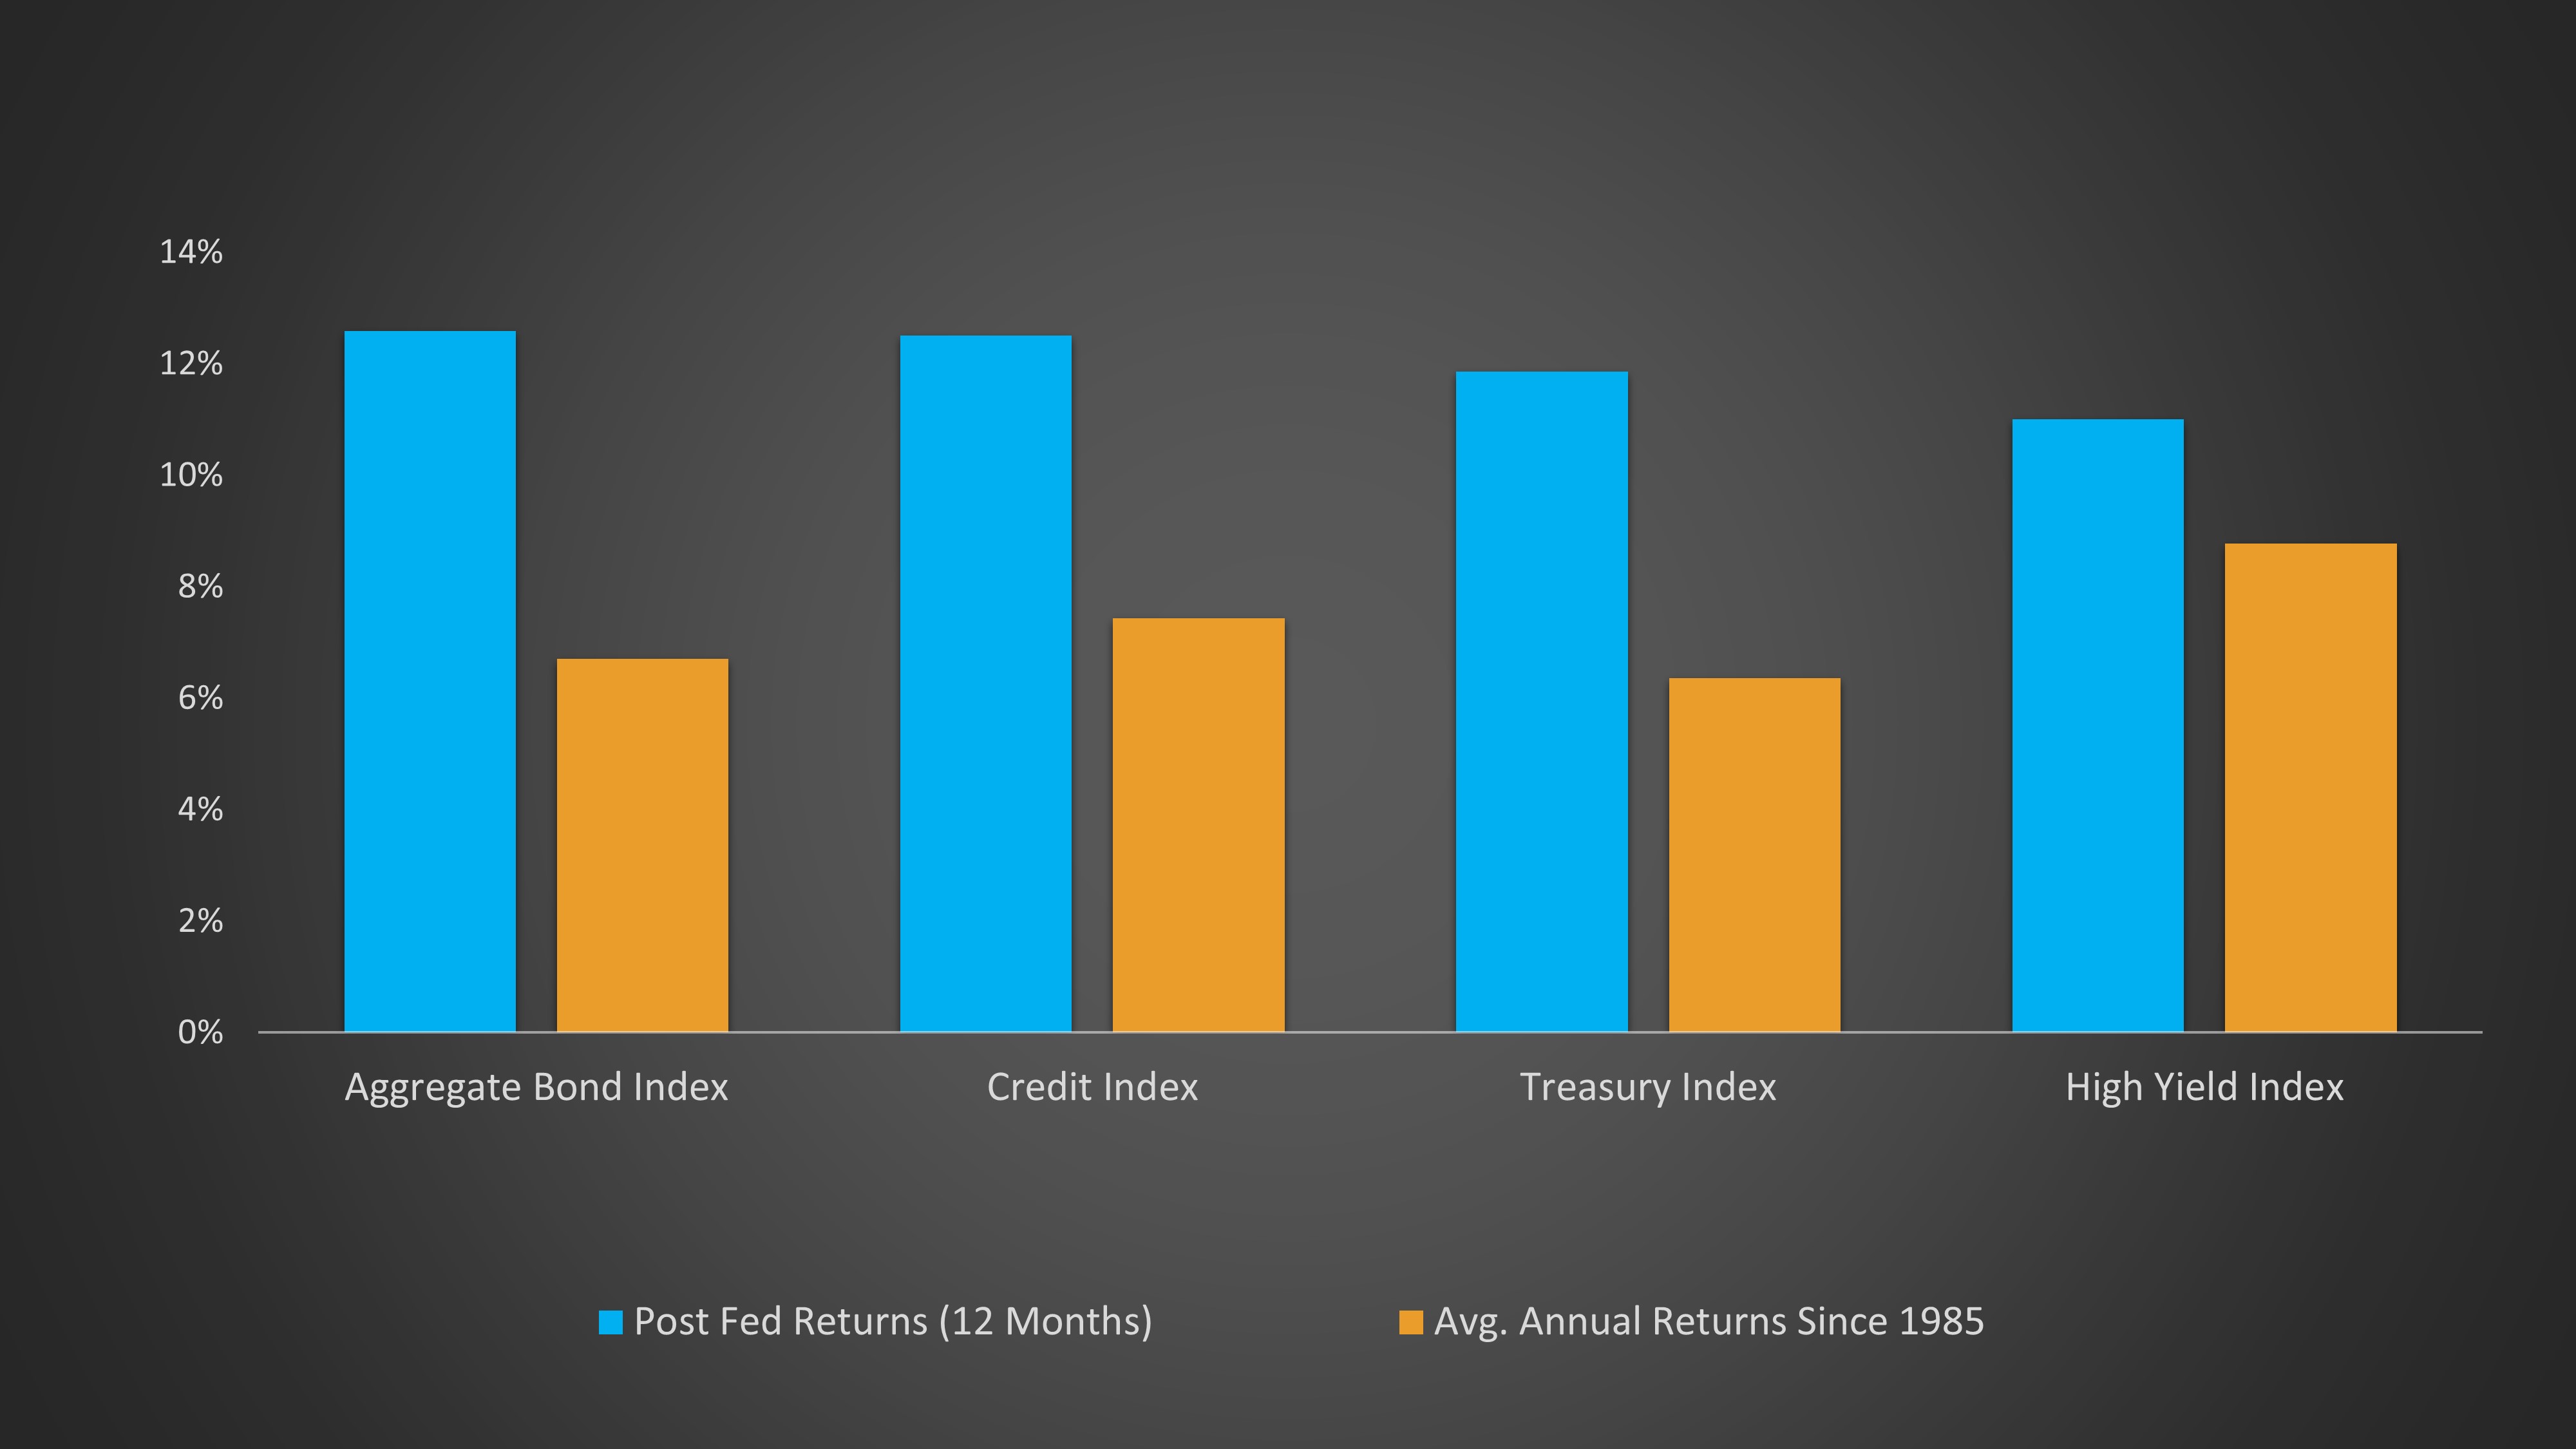
  1. Macro Risks Point to High-Quality Core Fixed Income Outperformance. Generating returns in fixed income will not come without its challenges, however, as some of the same headwinds causing a more bearish outlook for equities are also likely to impact credit spreads and the riskier segments of the global bond market. Tightening liquidity conditions, declining earnings growth, and growing recessionary concerns is not the most supportive backdrop for credit spreads, and we expect widening pressures throughout 2019, especially among the lower-quality tiers. This suggests the best returns for 2019 are likely to come from higher-quality core fixed income. This view is also supported by our post-Fed cycle return analysis, which shows that while historically all major bond segment returns are higher post-Fed cycle, the advantage of credit over Treasury returns is diminished and core IG outperforms high-yield.


Bond Returns: Long-Term vs. Post-Fed Cycle

          Source: Bloomberg


Disclosures: This is for informational purposes only and is not intended as investment advice or an offer or solicitation with respect to the purchase or sale of any security, strategy or investment product. Although the statements of fact, information, charts, analysis and data in this report have been obtained from, and are based upon, sources Sage believes to be reliable, we do not guarantee their accuracy, and the underlying information, data, figures and publicly available information has not been verified or audited for accuracy or completeness by Sage. Additionally, we do not represent that the information, data, analysis and charts are accurate or complete, and as such should not be relied upon as such. All results included in this report constitute Sage’s opinions as of the date of this report and are subject to change without notice due to various factors, such as market conditions. Investors should make their own decisions on investment strategies based on their specific investment objectives and financial circumstances. All investments contain risk and may lose value. Past performance is not a guarantee of future results.

Sage Advisory Services, Ltd. Co. is a registered investment adviser that provides investment management services for a variety of institutions and high net worth individuals. For additional information on Sage and its investment management services, please view our web site at www.sageadvisory.com, or refer to our Form ADV, which is available upon request by calling 512.327.5530.
Notes from the Desk: Municipal Bonds — The Turtle That Keeps On Winning!

Both classic and modern literature have countless stories of seemingly outmatched opponents finding a way to persevere and even prevail, despite the odds. One of our favorite examples, especially since we are talking about municipal bonds, is Aesop’s Fable “The Tortoise and the Hare” in which the slow and steady Turtle unexpectedly wins a race against the seemingly unbeatable Hare. Despite both literary and real-life examples of these events occurring time and time again, social influences, behavioral factors, and cognitive distortions cause many investors to keep betting, or in this case, investing in the proverbial “Hare.” Although adjectives like steady, stodgy, and plain-vanilla do not elicit a rousing response, municipal bonds continue to provide investors with positive returns, low volatility, and steady tax-free income.

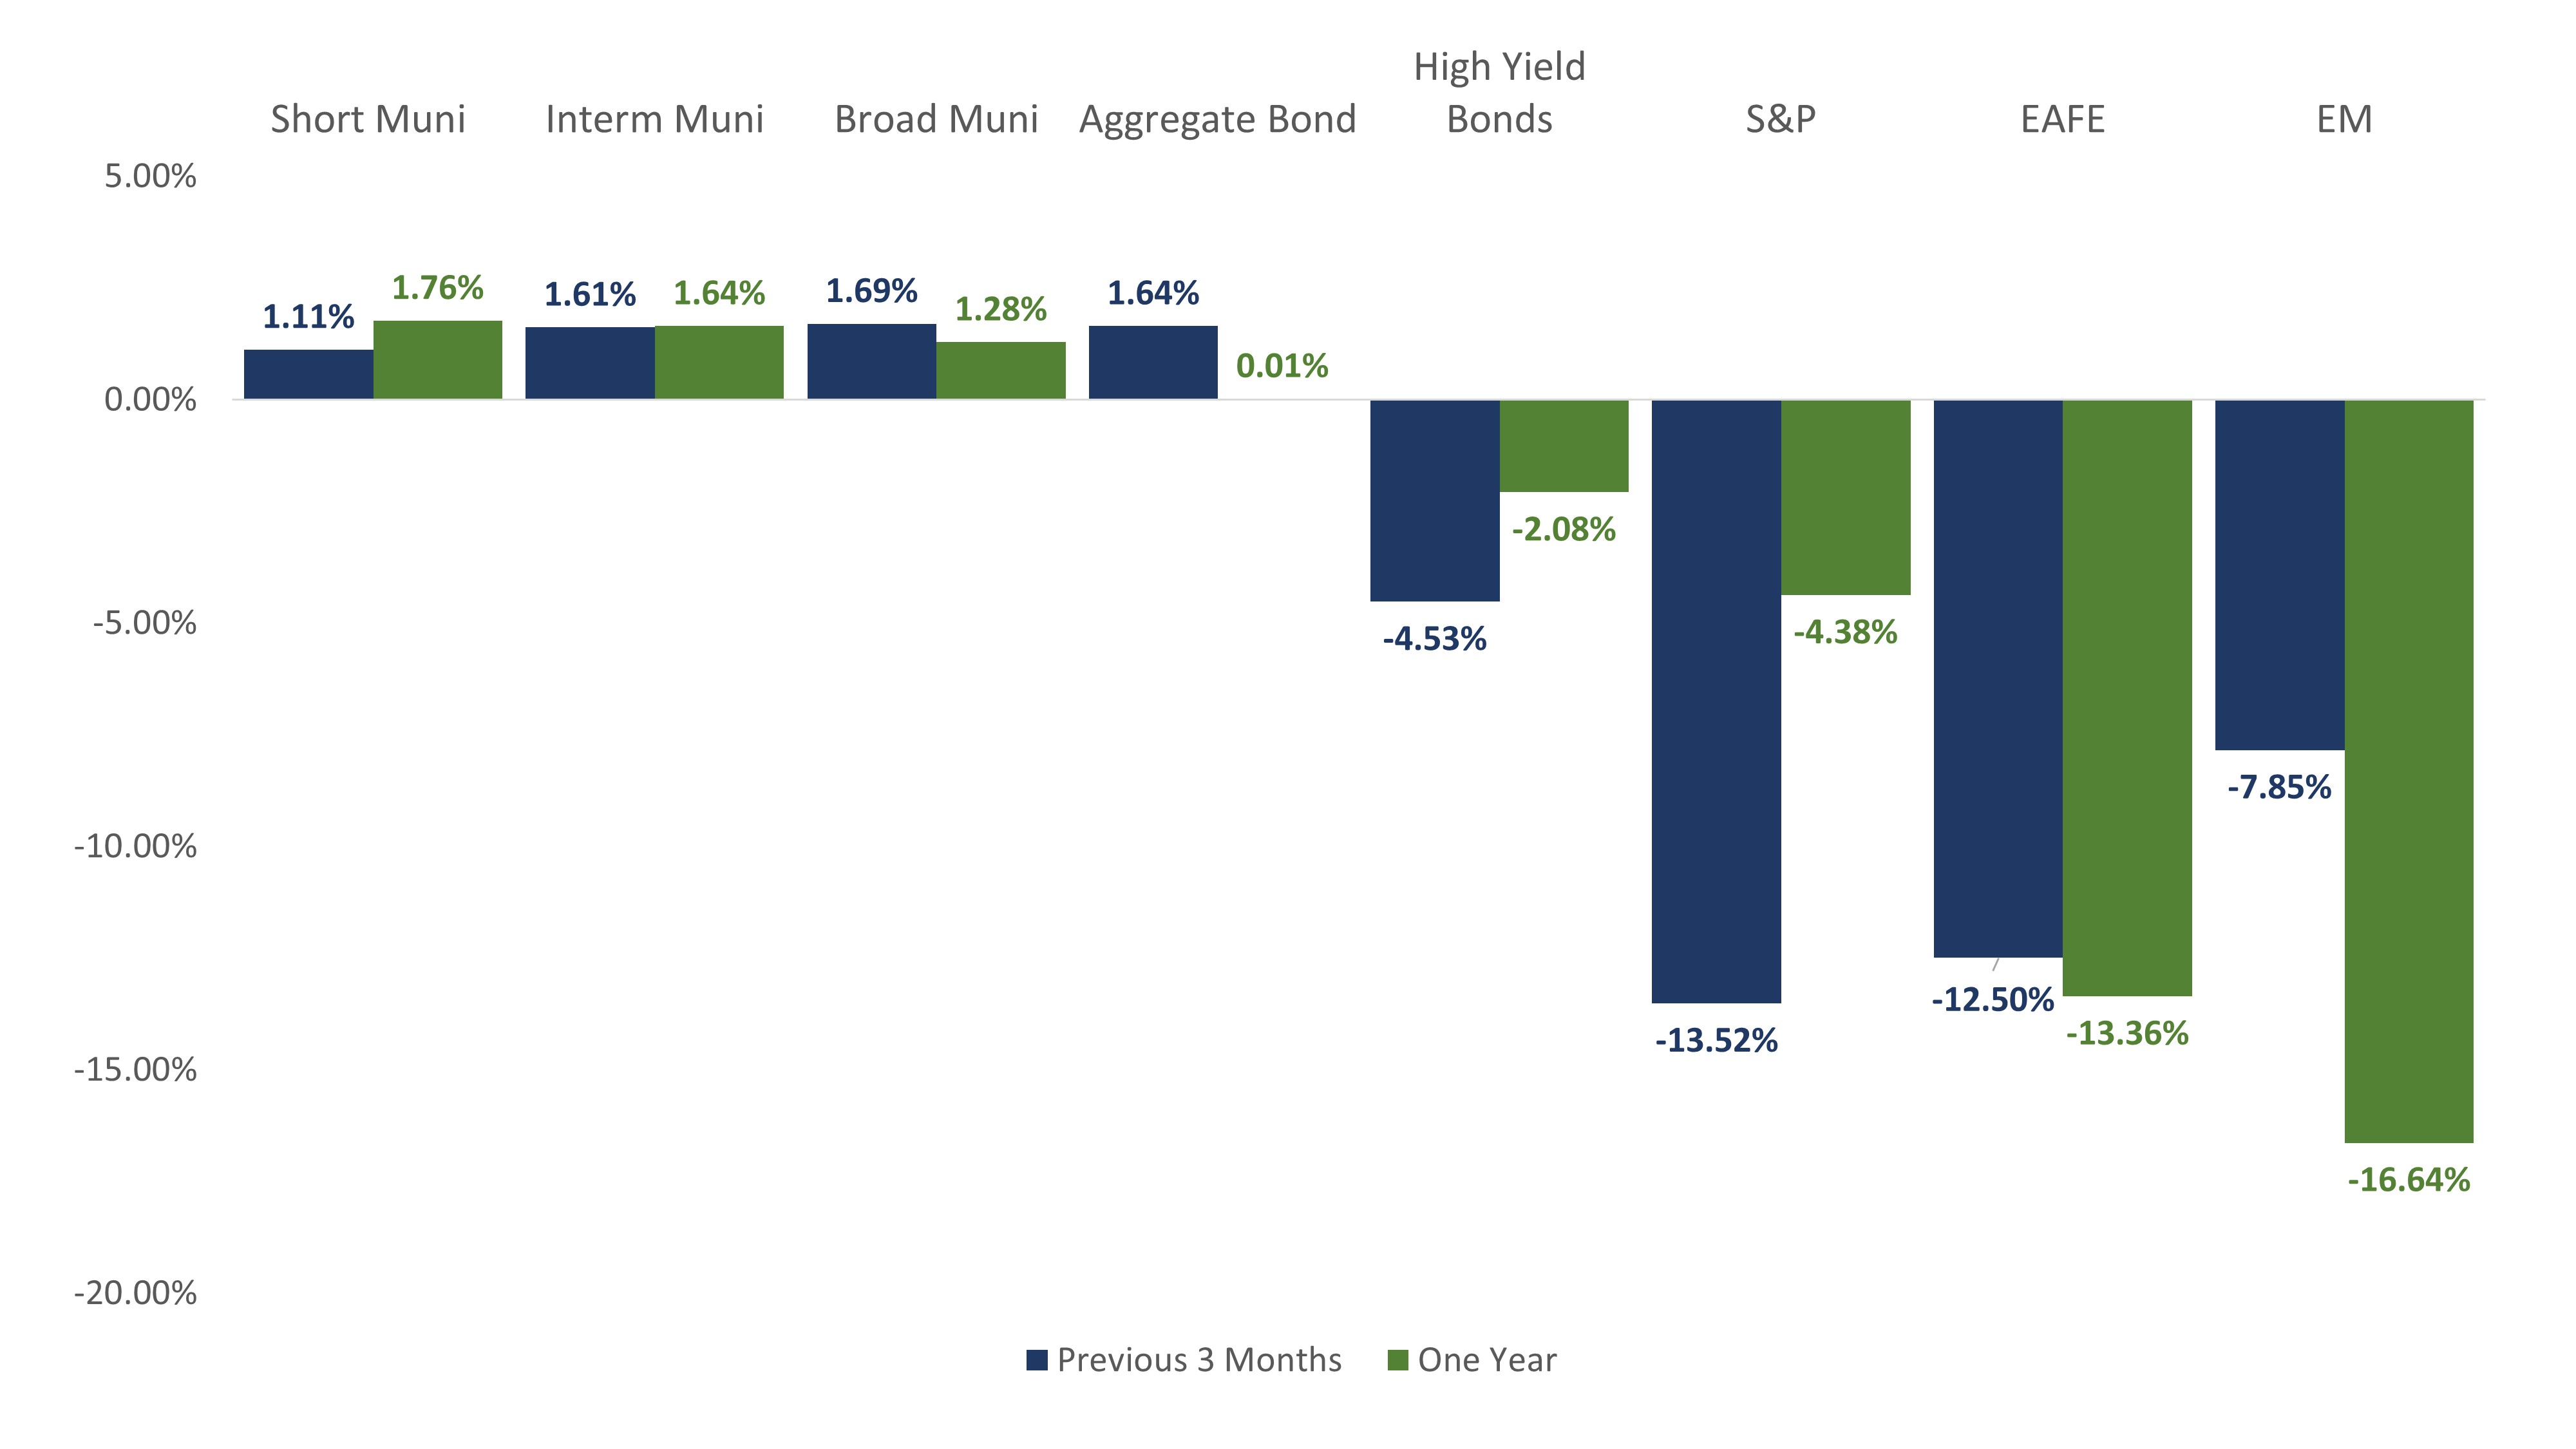
Once again in 2018, the municipal market showed its merit and provided investors with positive returns, low volatility, and ample liquidity during a time when it was needed most. Despite a quarter or two of low or negative returns earlier in the year, municipal bonds finished 2018 in positive territory as most other core asset classes experienced significant challenges, as shown below:

Market Environment

Source: BarclaysLive and Bloomberg as of 12/31/18


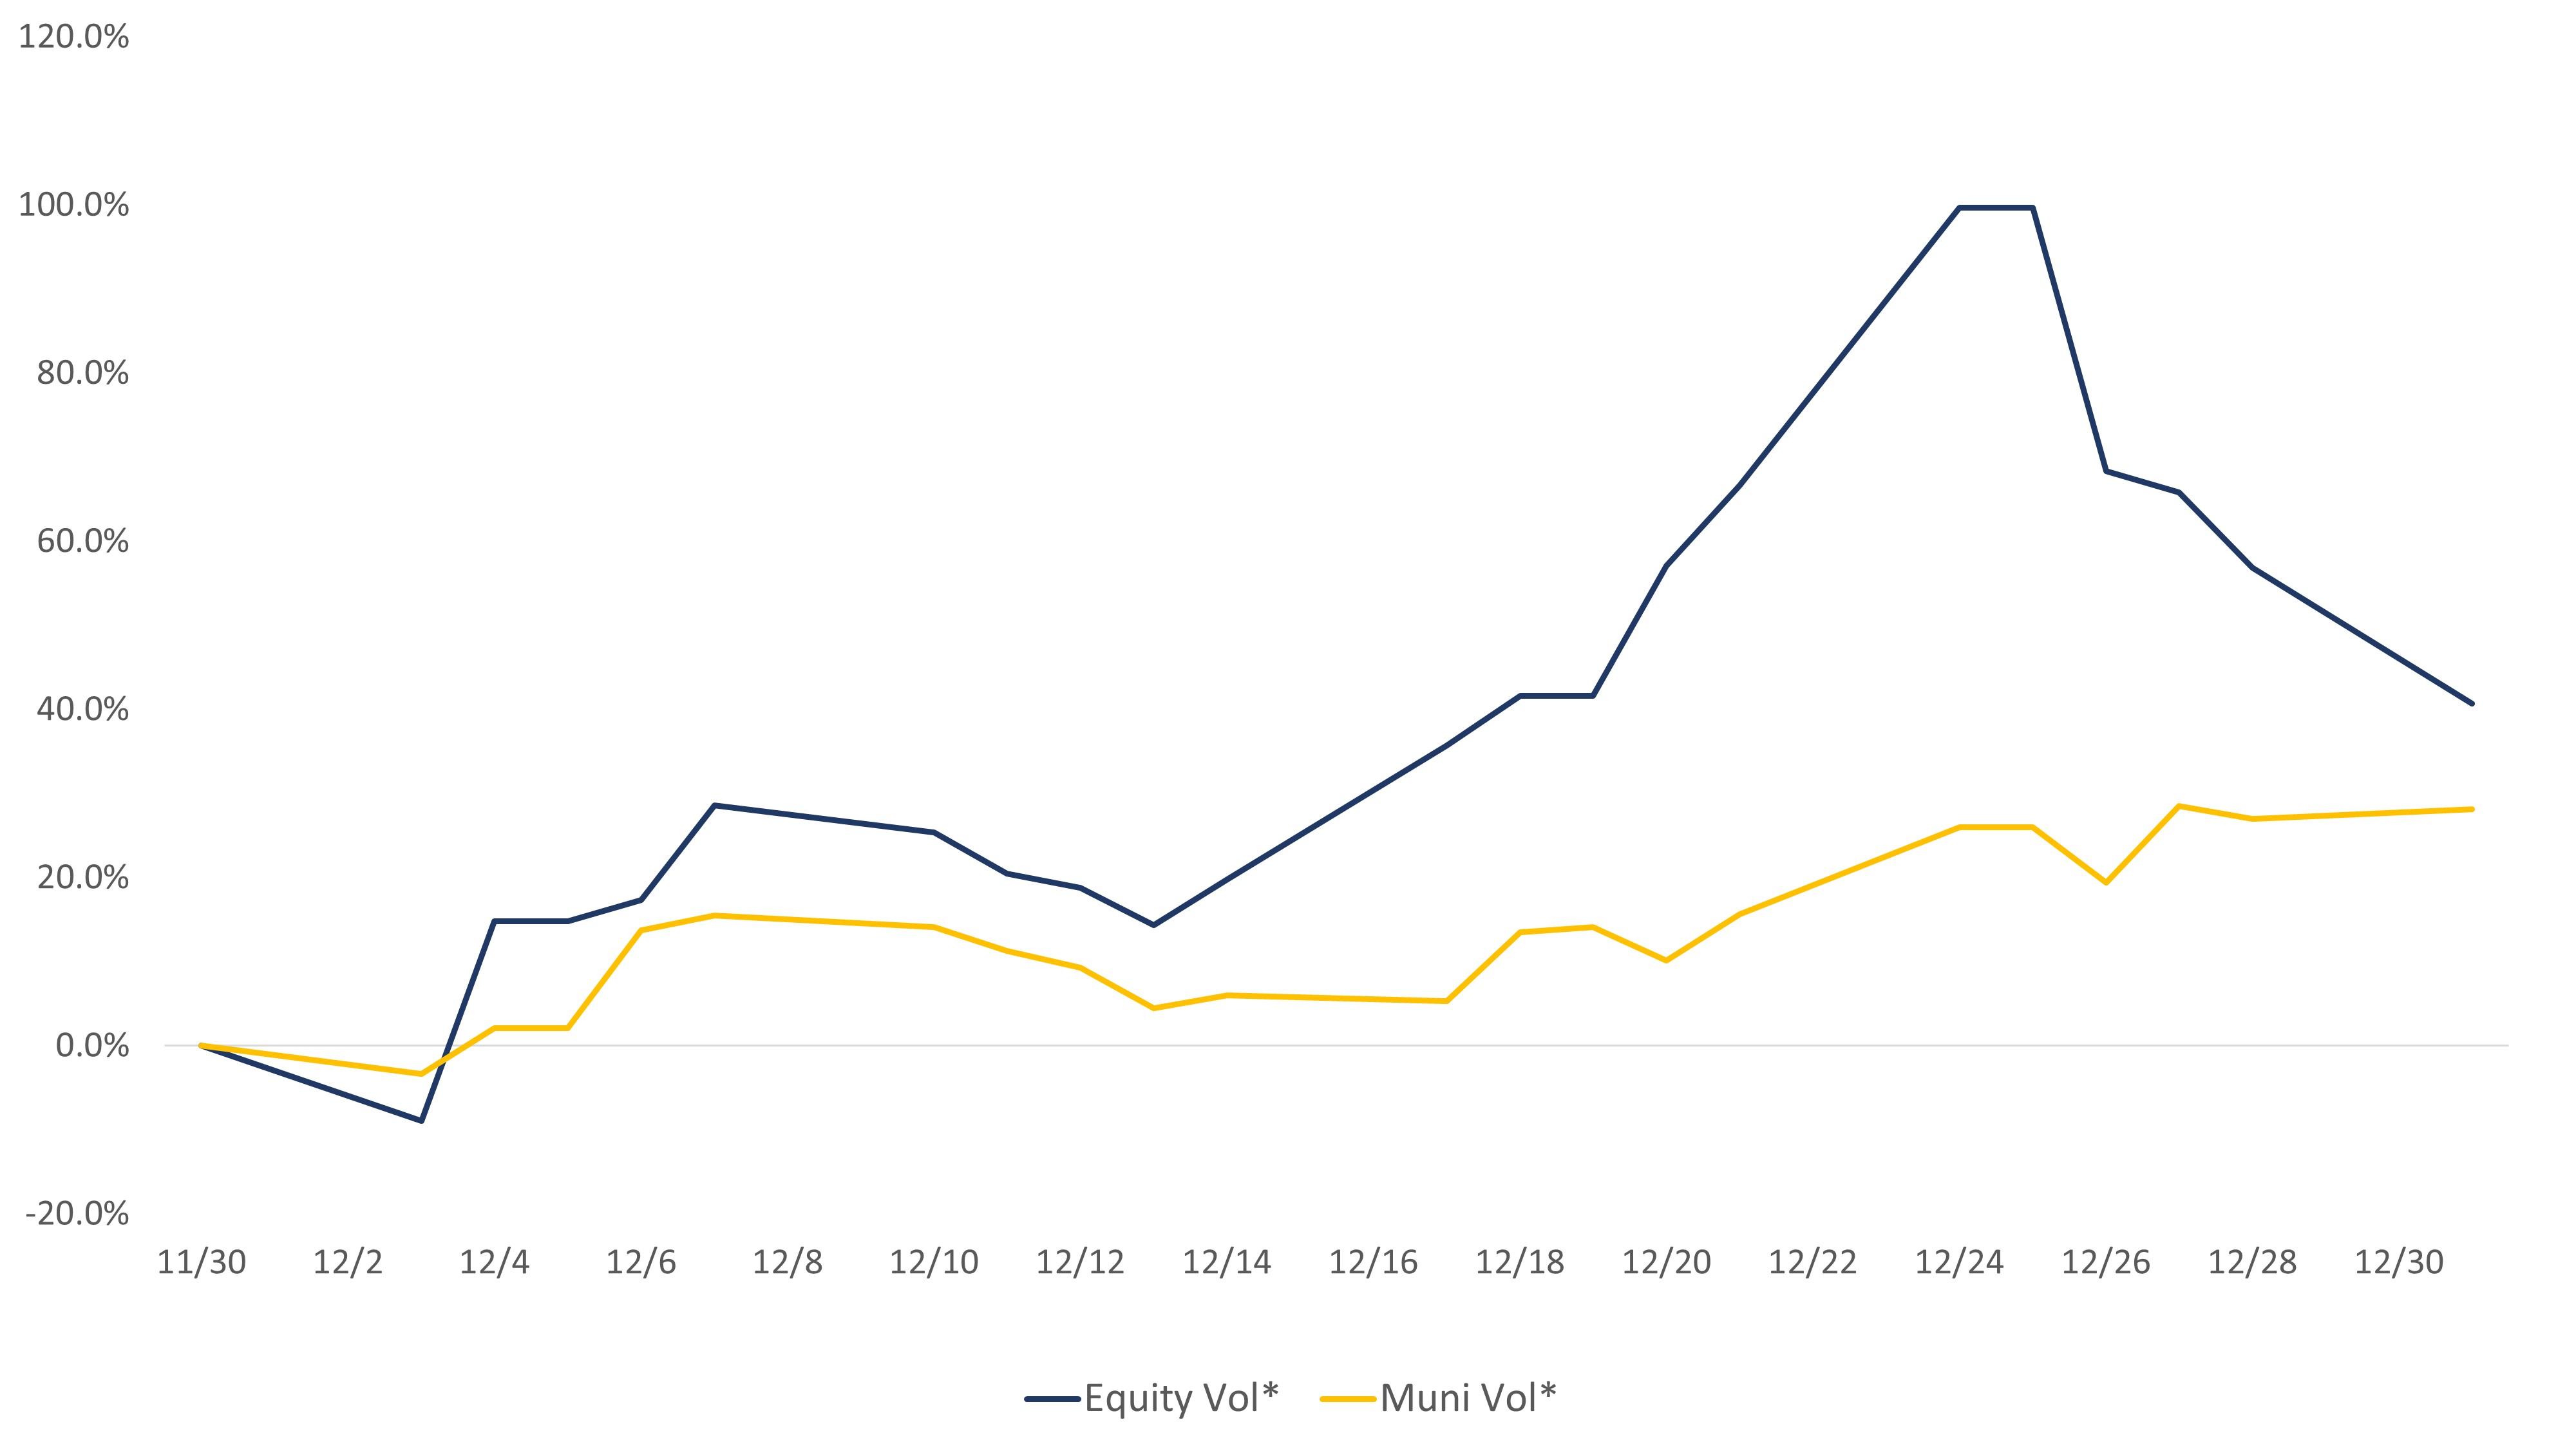
Despite the recent tumult of the global equity and corporate credit markets, municipal bond volatility was much more muted in comparison to the U.S. equity market, further validating municipal bonds’ role as a negatively correlated asset class that financial advisors and clients rely upon during times of market turmoil.


Market Volatility Comparsion (% Chg from 11/30/18 to 12/31/2018)

* VIX Index for Equity Vol, Move Index for Muni Vol, adjusted with daily M/T ratio


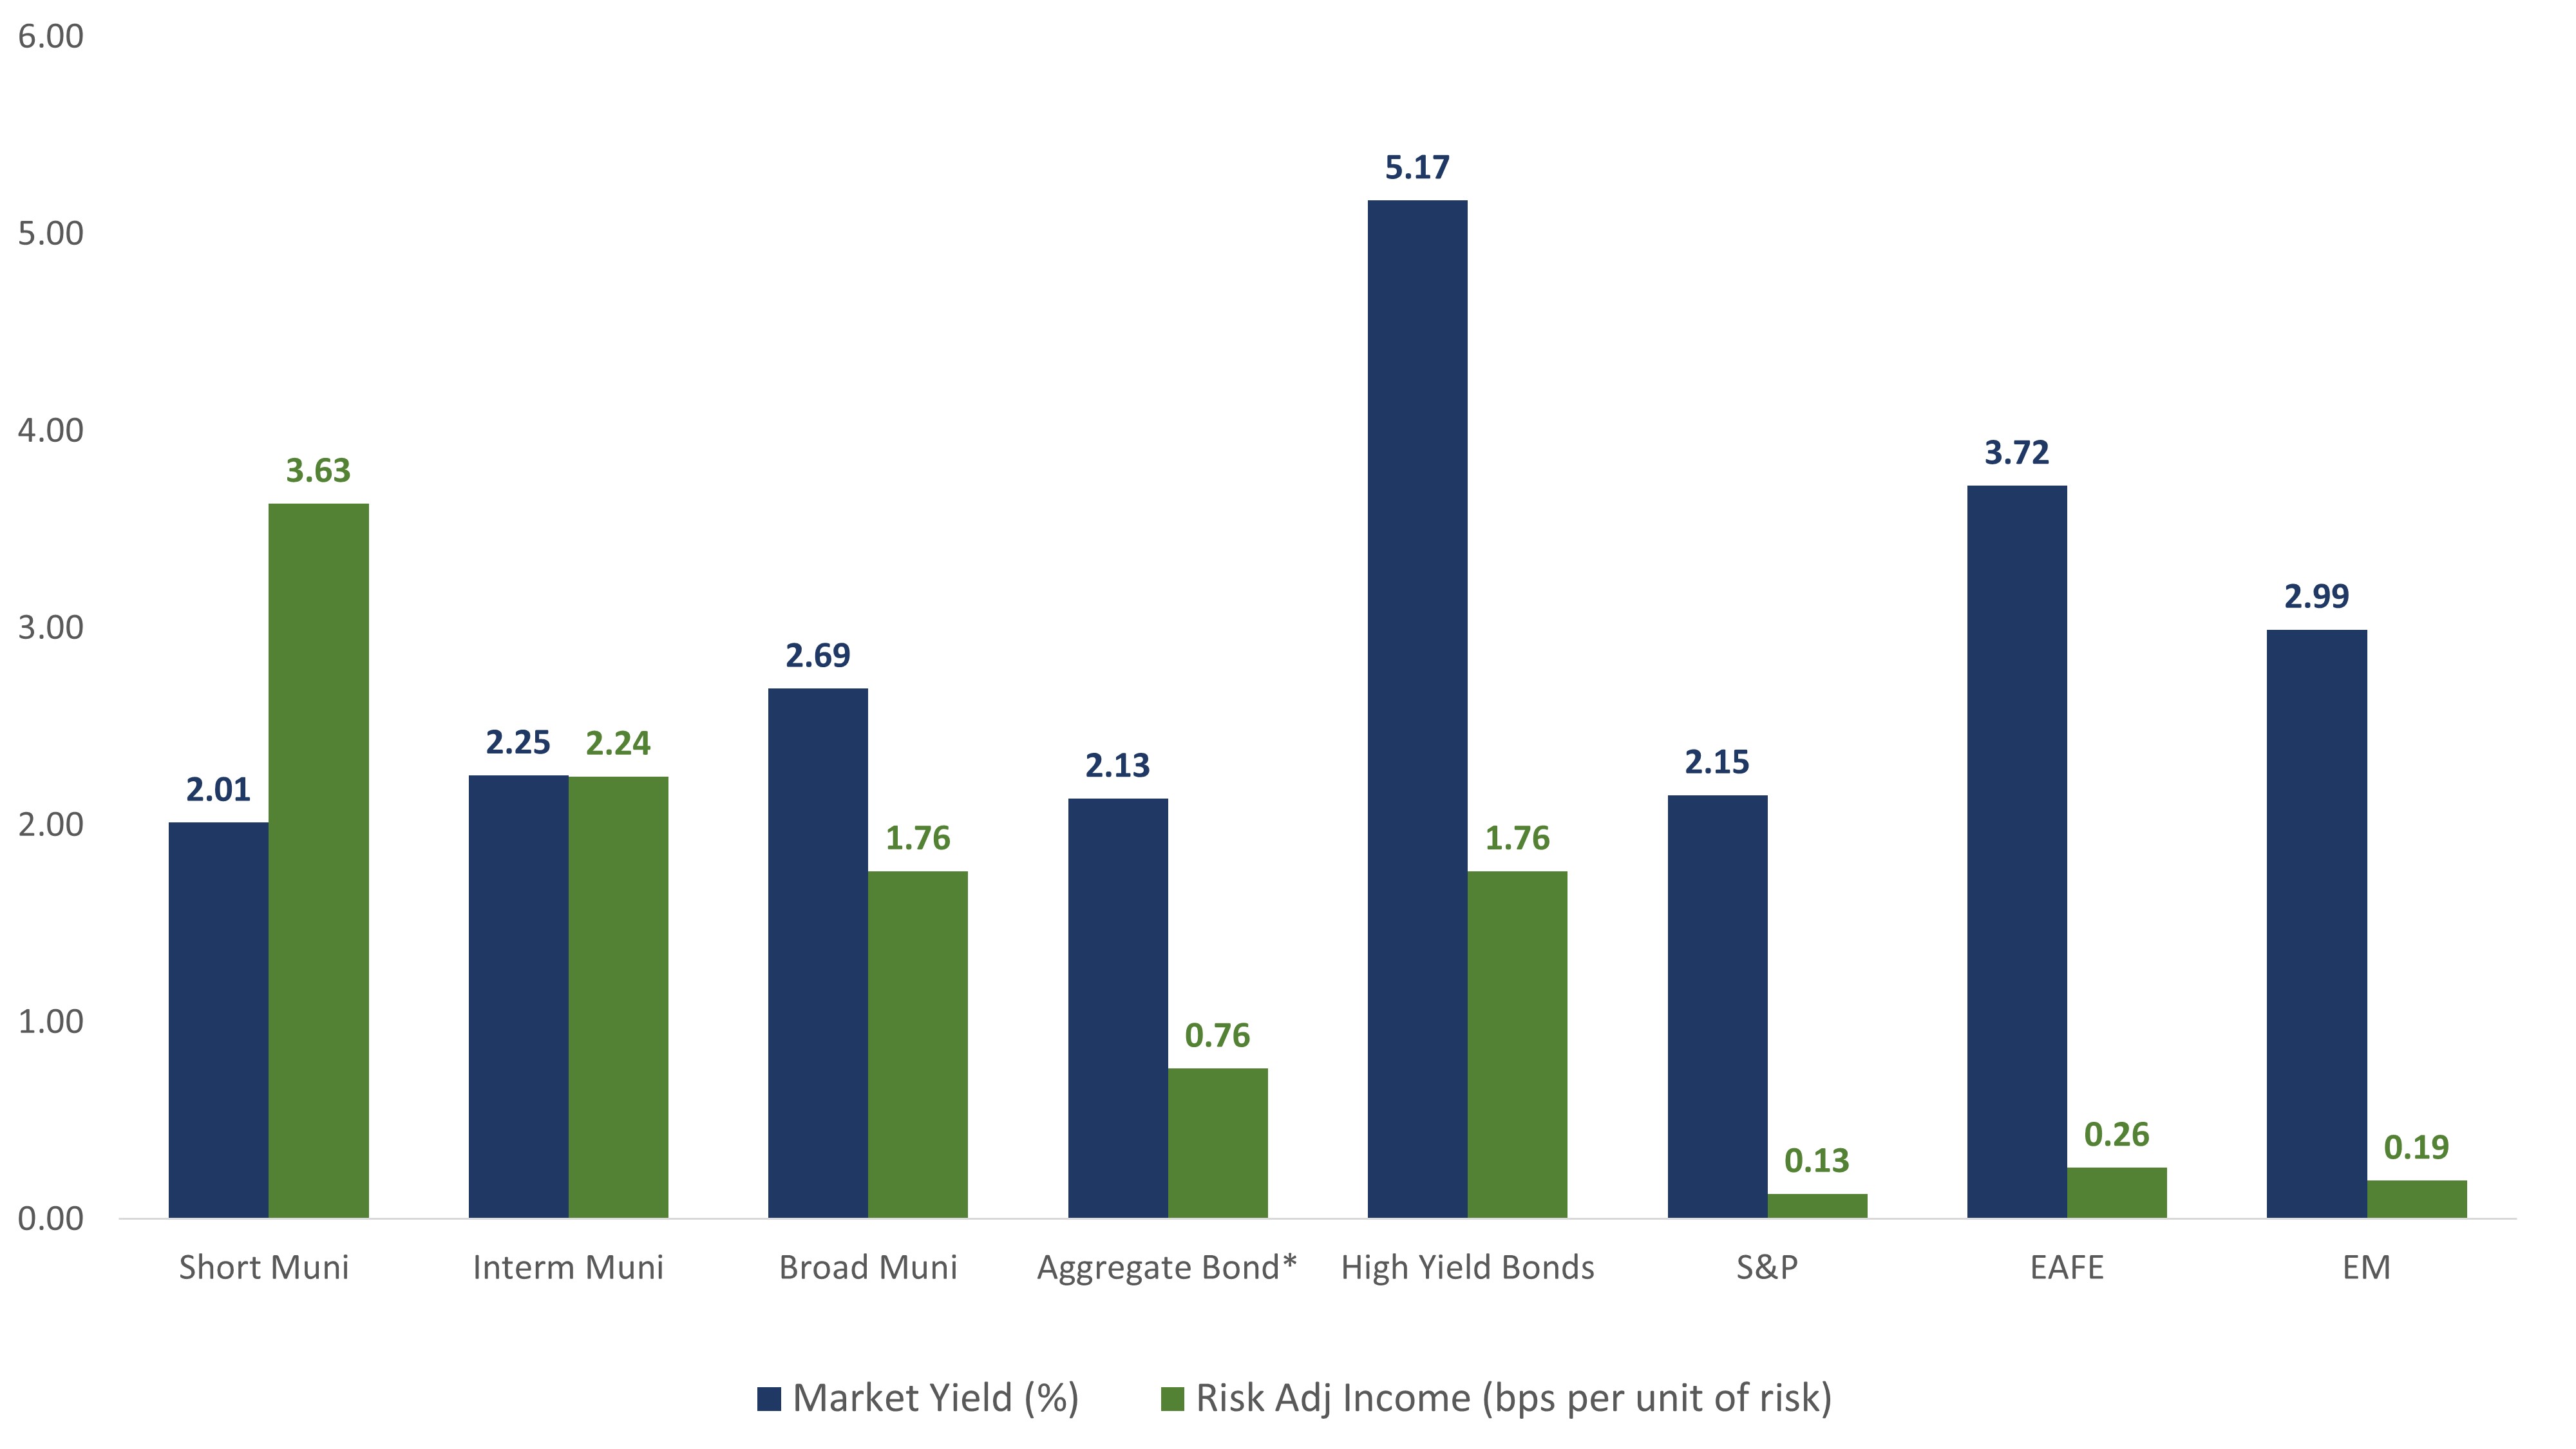
Furthermore, municipal bonds not only provide attractive income on a tax-free basis, but they also accomplish this objective with significantly less risk. An often-overlooked measure of income generation efficiency is risk-adjusted income. Relative to other income-producing asset classes, municipal bonds generate higher levels of income per unit of risk, particularly versus equities, which display pre-tax yields. This is illustrated in the chart below:


Market Yield and Risk-Adjusted Income

Source: BarclaysLive and Bloomberg as of 12/31/18, Agg & HY yield tax-adjusted at 35%


Despite the inherent benefits of municipal bonds, naysayers will continue to belittle the fixed income Tortoise and praise the equity Hare. For 2019, Sage is betting on the Tortoise.


Disclosures: This is for informational purposes only and is not intended as investment advice or an offer or solicitation with respect to the purchase or sale of any security, strategy or investment product. Although the statements of fact, information, charts, analysis and data in this report have been obtained from, and are based upon, sources Sage believes to be reliable, we do not guarantee their accuracy, and the underlying information, data, figures and publicly available information has not been verified or audited for accuracy or completeness by Sage. Additionally, we do not represent that the information, data, analysis and charts are accurate or complete, and as such should not be relied upon as such. All results included in this report constitute Sage’s opinions as of the date of this report and are subject to change without notice due to various factors, such as market conditions. Investors should make their own decisions on investment strategies based on their specific investment objectives and financial circumstances. All investments contain risk and may lose value. Past performance is not a guarantee of future results.

Sage Advisory Services, Ltd. Co. is a registered investment adviser that provides investment management services for a variety of institutions and high net worth individuals. For additional information on Sage and its investment management services, please view our web site at www.sageadvisory.com, or refer to our Form ADV, which is available upon request by calling 512.327.5530.
Notes from the Desk: Yield Curve Inversion — What’s Different This Time?

Crossing the Rubicon – Yield Curve Inversion

In 49 BCE a provincial governor named Julius Caesar and a single legion of troops crossed a small stream in northern Italy – the Rubicon River – sparking a civil war that led to Caesar’s reign and changed the course of history for Rome. Today, the phrase “Crossing the Rubicon” serves as a metaphor for taking irrevocable steps toward an outcome. In the financial markets, no indicator of an economic recession is as synonymous with the Rubicon as the slope of the yield curve crossing into negative territory.

The first week of trading in December saw the much-awaited inversion of the yield curve, with the 5-year Treasury yield trading below the 2-year yield for the first time since June 2007. Another commonly cited yield curve measure, the spread between the 10-year and 2-year, has not yet moved into negative territory, but typically follows the 5-year and 2-year spread into inversion territory.


Source: Sage, Bloomberg as of 12/6/2018


Historically, the yield curve has proved to be an accurate indicator of economic recessions. In the 1980s, early 1990s, early 2000s, and at the dawn of the Global Financial Crisis in 2006, the yield curve inverted in advance of a recession. What does the inversion signify and how does it contribute to the market outlook going into 2019?

An inverted yield curve is a symptom of tightening monetary conditions from the Federal Reserve, which serves to slow credit, asset price, and economic growth – and typically results in a recession. The degree of the slowdown depends on the fragility of the underlying economic picture. The Fed has the difficult task of keeping conditions such that the economy grows at a sustainable rate, but not so fast as to produce asset bubbles. The additional factor of the unwind of Quantitative Easing, for the first time since the 1930s, adds to the degree of difficulty of this task.

The markets are preparing for the end game of the current economic expansion. We expect a further period of higher volatility and low liquidity, absent additional public support through fiscal stimulus or markedly more accommodative policy from the Federal Reserve.

Yield Curve Inversion is a Symptom of Tight Money Policy, not a Trigger of a Potential Slowdown

Fed tightening typically involves raising short-term interest rates to the point where financial conditions become sufficiently tight to create economic headwinds and cast doubt on future growth. That doubt on future growth could manifest into a flatter yield curve and demand for longer-duration assets versus shorter-duration assets. During the most recent Fed Cycle, the flattening of the yield curve has coincided with continued Fed hikes.


Source: Sage, Bloomberg as of 12/6/2018


In fact, Fed hiking cycles typically result in flatter curves. Looking back to Fed hiking cycles starting 1976, the chart below shows that Fed hiking cycles coincide with a decreased slope of the yield curve.

Sage, Bloomberg as of 12/6/2018


A Recession is Not Imminent, but We’re Moving in the Wrong Direction

Inverted yield curves don’t mean a recession is imminent. Going back to the mid-1970s, the average time from when the yield curve moves into negative territory to the start of a recession is 19 months.


Source: Sage, Bloomberg


What’s Different This Time?

As the saying goes, “history doesn’t repeat itself, but it often rhymes,” the same goes for the business cycle. At the macro level, growth, inflation, and policy drive the evolution of the cycle, but there are often facets of those themes that are different. In the current cycle, one facet stands above all: the unwind of Quantitative Easing.

In its effort to stimulate the economy when the Fed Funds Rate dropped to zero, the Fed instituted the asset purchase program, which ballooned the Fed’s balance sheet from $900 billion to $4.5 trillion. The purchase of financial assets resulted in a “portfolio rebalance” dynamic in which lower long-term interest rates forced investors to move out into riskier and riskier asset classes to earn the same yield. Volatility fell and remained low as investors were assured that the Fed would continue to buy bonds.

The opposite dynamic is happening today. Tightening monetary policy now includes raising interest rates and shrinking the Fed balance sheet. The lack of buying has created a void in the marketplace, as investors rebalance into safer asset classes – cash becomes more attractive. Volatility has picked up, and as long as the Fed remains out of the markets, volatility is likely here to stay.


Source: Sage, Bloomberg as of 12/6/2018


Disclosures: This is for informational purposes only and is not intended as investment advice or an offer or solicitation with respect to the purchase or sale of any security, strategy or investment product. Although the statements of fact, information, charts, analysis and data in this report have been obtained from, and are based upon, sources Sage believes to be reliable, we do not guarantee their accuracy, and the underlying information, data, figures and publicly available information has not been verified or audited for accuracy or completeness by Sage. Additionally, we do not represent that the information, data, analysis and charts are accurate or complete, and as such should not be relied upon as such. All results included in this report constitute Sage’s opinions as of the date of this report and are subject to change without notice due to various factors, such as market conditions. Investors should make their own decisions on investment strategies based on their specific investment objectives and financial circumstances. All investments contain risk and may lose value. Past performance is not a guarantee of future results.

Sage Advisory Services, Ltd. Co. is a registered investment adviser that provides investment management services for a variety of institutions and high net worth individuals. For additional information on Sage and its investment management services, please view our web site at www.sageadvisory.com, or refer to our Form ADV, which is available upon request by calling 512.327.5530.