Trust Accounts Benefit from Tax-Exempt Income

by Jeffrey Timlin

Unlike the graduated federal income tax brackets that max out at 37% with taxable income at $500k or more, trust accounts benefit from owning municipal bonds at a significantly lower tax bracket. As the political and economic environment becomes increasingly uncertain, many high-net-worth clients are turning to trusts to protect their assets as well as provide a tax-efficient way to transfer assets to family members. In 2012, the American Taxpayer Relief Act (ATRA) added new net investment income tax (NIIT) brackets for certain trusts as shown in the tax table below.


Source: IRS.gov


For clients in non-grantor trusts, the benefit of owning municipal bonds is realized almost immediately since the maximum income bracket tops out at only $12,500. As an added benefit, by utilizing tax-exempt municipal bonds to produce income, the trust’s beneficiary could also avoid paying the 3.8% investment income tax associated with the Affordable Care Act of 2010 for a maximum tax savings of 40.8%. Depending on the state of residence, an allocation to in-state municipal bonds may further enhance the tax-efficiency of the income generated within the trust.

Since the inception of municipal bonds, high-net-worth individuals have successfully utilized the benefits of tax-exempt income. Along with tax-free income, investors have benefited from a high degree of principle protection and low levels of price volatility. To ensure the proper use of municipal bonds within a trust, please review the trust agreement with your financial advisor, tax accountant, and trust attorney. Once approved, allocating to municipal bonds could significantly reduce your annual tax liability.


Disclosures: This is for informational purposes only and is not intended as investment advice or an offer or solicitation with respect to the purchase or sale of any security, strategy or investment product. Although the statements of fact, information, charts, analysis and data in this report have been obtained from, and are based upon, sources Sage believes to be reliable, we do not guarantee their accuracy, and the underlying information, data, figures and publicly available information has not been verified or audited for accuracy or completeness by Sage. Additionally, we do not represent that the information, data, analysis and charts are accurate or complete, and as such should not be relied upon as such. All results included in this report constitute Sage’s opinions as of the date of this report and are subject to change without notice due to various factors, such as market conditions. Investors should make their own decisions on investment strategies based on their specific investment objectives and financial circumstances. All investments contain risk and may lose value. Past performance is not a guarantee of future results.

Sage Advisory Services, Ltd. Co. is a registered investment adviser that provides investment management services for a variety of institutions and high net worth individuals. For additional information on Sage and its investment management services, please view our web site at www.sageadvisory.com, or refer to our Form ADV, which is available upon request by calling 512.327.5530.


Credit Quality at Regional Banks May Signal Economic Slowdown

by Ryan O’Malley

Will years of aggressive lending finally catch up with the U.S. economy at precisely the wrong time?

The U.S. economy is firing on all cylinders, with unemployment near record lows, labor force participation near record highs, and GDP growth and inflation moving along perfectly in line with the targets set by the U.S. Federal Reserve. Despite this rosy backdrop, signs of stress are appearing in one segment of the economy: regional banks.

Increasing Percentage of Leveraged Loans Among Regional Banks

According to a Moody’s survey of 38 regional banks, the percentage of leveraged loans at regional banks is increasing; 45% of regional banks expect their total amount of leveraged loans outstanding to increase over the next two to three years. Perhaps more concerning, nearly 50% of the outstanding loans held at these regional banks are unrated by Moody’s or S&P, reducing transparency for bank executives and investors. Overall, leveraged commercial loan exposure remains low at 3%, but the trend appears to be toward riskier credits, as banks struggle to compete with more aggressive non-bank lenders for business.

In addition to more leverage, there is some evidence that credit quality has started to suffer, leading to tighter lending standards. A recent survey by the Federal Reserve of 73 domestic banks found that in every loan category, a significant portion of banks expected to see loan performance “deteriorate somewhat.” These same loan officers surveyed indicated that their employers are beginning to exhibit a “reduction in risk tolerance” not seen in previous years.


Source: St. Louis Federal Reserve


This is classic “late-cycle” behavior by banks. When credit conditions start to deteriorate, banks begin to tighten lending standards, which can cause available credit to dry up right when the economy needs liquidity the most.


How is Sage Positioning for a Potential Credit Crunch?

At Sage, we are monitoring this situation closely. This trend will undoubtedly affect credit quality at the regional banks, but also has important implications for the overall U.S. economy.

Regional banks provide much of the lending to smaller businesses and the property development industry in the United States. If liquidity for these important growth engines begins to dry up due to concerns about credit quality caused by years of aggressive lending, the overall growth of the U.S. economy could begin to sputter.


Source: St. Louis Federal Reserve


The velocity of the money supply in the U.S. has been declining for years, indicating that consumers are transacting less on each dollar of supply put into the system than they were 20 years ago. This means that as the Federal Reserve has pumped more and more liquidity into the system, there is a smaller marginal increase in spending per dollar added. Recently, the Federal Reserve has begun to shrink the size of their balance sheet, which has raised concerns that liquidity is drying up in the banking sector, which could lead to less lending by banks going forward. Sectors that may be vulnerable to a slowdown in grassroots lending growth are to be avoided. This includes capital goods, real estate development, and consumer products.

This somewhat precarious situation has made us concerned that the positive business cycle of the past 10 years may be coming to an end. Given this view, we believe now is the time to begin trimming more illiquid positions that have experienced outsized price performance.


Disclosures: This is for informational purposes only and is not intended as investment advice or an offer or solicitation with respect to the purchase or sale of any security, strategy or investment product. Although the statements of fact, information, charts, analysis and data in this report have been obtained from, and are based upon, sources Sage believes to be reliable, we do not guarantee their accuracy, and the underlying information, data, figures and publicly available information has not been verified or audited for accuracy or completeness by Sage. Additionally, we do not represent that the information, data, analysis and charts are accurate or complete, and as such should not be relied upon as such. All results included in this report constitute Sage’s opinions as of the date of this report and are subject to change without notice due to various factors, such as market conditions. Investors should make their own decisions on investment strategies based on their specific investment objectives and financial circumstances. All investments contain risk and may lose value. Past performance is not a guarantee of future results.

Sage Advisory Services, Ltd. Co. is a registered investment adviser that provides investment management services for a variety of institutions and high net worth individuals. For additional information on Sage and its investment management services, please view our web site at www.sageadvisory.com, or refer to our Form ADV, which is available upon request by calling 512.327.5530.


Rising Taxes and Out-Migration Trends: A Bad Budgetary Combo

by Jeffrey Timlin

Numerous major metropolitan cities have experienced an economic boom over the past decade as the technology, energy, health care, and financial industries have flourished. Although their fiscal outlook has improved dramatically since the Great Recession, municipalities face several challenges. An influx of highly paid employees has been a double-edged sword. Tax revenue has increased but so has the cost of living, which has decreased affordability for public service workers. Raising taxes to pay higher salaries for public service workers is only a short-term solution, as municipalities will eventually have to grapple with their main source of revenue – wealthy taxpayers – moving to less-taxing states.

Politicians have been talking about the wealth gap for decades yet have done little to fix the real issue. In this case, the benefits of economic success are being offset by the challenges associated with providing enough public services. That may seem counterintuitive since with more revenue generated comes greater funding ability. However, public services are often the largest municipal expenditure, and the public employees providing these services – teachers, firefighters, police – require an adequate salary to afford to live in the areas they serve. The additional revenue received from high-income tax payers has not been enough to support necessary salary and benefit increases to support the increased cost of living for public service employees. (It is important to note that salaries and benefits for public employees are fixed and don’t fluctuate in-line with tax revenue.) Just look at the defaults of Puerto Rico, Detroit, and Vallejo.


Although the top 10 cities listed above are currently rated AA or better, the growing economic strain associated with the need for additional public services remains unsustainable and will eventually bring greater downward pressure on their respective credit ratings.

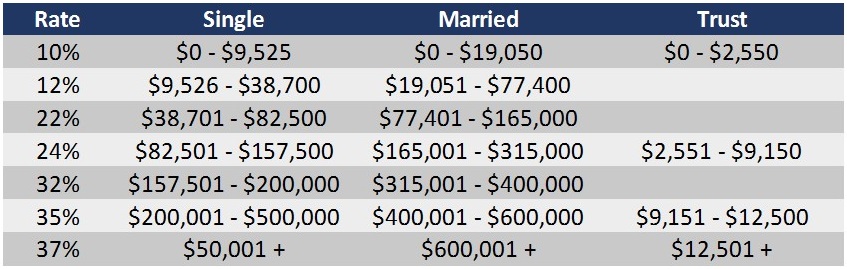
A good example of this challenge is found in not only New York City but, more importantly, in New York State, which recently announced a projected $2.3 billion budget deficit. According to New York State officials, this is the most serious revenue shock the state has faced in many years and it is expected to worsen before it gets better. Fiscal imbalances of this nature and magnitude are becoming more common among those cities and states with exceedingly high tax burdens. Indeed, according to a recent WalletHub survey that looked at the combined state income, property and sales tax burdens paid by citizens, New York came in first, at 13.04%; with Illinois, New Jersey, and California close behind.

Ongoing political pressure to resolve these challenges will undoubtedly lead to an increase in tax rates, primarily on the wealthy. Although this may initially seem appropriate and prudent, the high reliance on high-net-worth residents can be fickle. Unfortunately, voters and politicians severely discount the ability of wealthy individuals to relocate to friendlier tax environments. For example, growing tax burdens have become a force for significant out-migration from the Northeast and California to places like Florida and Texas. According the 42nd Annual National Movers study by United Van Lines, last year 61.5% of New York residents left the state, while just 38.5% moved there. More importantly, of those who left, 41% earned $150,000 or more and only 8.4% earned less than $50,000. It is also worth noting that New York City, a traditional magnet for the young and talented, saw the biggest loss of millennials last year compared to other large cities, with more than 29,000 residents moving elsewhere.

Although no major municipality has experienced a sudden outflow of wealthy residents, a slow but steady outflow has a cumulative effect on budgets. This is showing up in places like New York, which from 2010 to 2017 suffered a net out-migration of over 1 million taxpayers, a level that was more than any other state, including California, which lost just under 1 million taxpayers over the same period. This apparent secular out-migration trend is particularly troubling because the top 1% of New York State earners pay 46% of all the income taxes collected by the state.


As states like New York, New Jersey, Connecticut, Illinois, California, and the major cities within them, become more dependent on an increasingly smaller number of high-income taxpayers to fund their growing fiscal deficits, the ongoing leakage of these outbound taxpayers can and will cause significant budget disruptions for the municipalities and their respective creditors.

We believe that these trends, if left unresolved through significant budget expense adjustments, will become increasingly difficult for creditors and credit ratings agencies to ignore. An eroding tax base is difficult for most municipal governments to curtail once trends such as those cited above get firmly underway. Adding to our concern about these trends is the recognition that the U.S. economy continues to enjoy a robust level of economic activity. Until now this has allowed many state and city governments to defer any meaningful spending adjustments, and they have preferred to raise income taxes to punitive levels in order to close short-run funding gaps. At some point, the current favorable environment will dissipate and disappoint. That is the day of reckoning that creditors should be concerned about in the months ahead.

As always, the determining factor for investors looking to make allocations to municipal bonds remains valuations. In the current environment, our view is that many of these tax burdensome issuers do not provide enough yield reward relative to municipal issuers from other regions or possibly taxable corporate bonds with similar credit profiles, unless you are a resident of the high tax rate state. Fortunately for our clients and investors in general, the municipal market provides numerous beneficial alternatives to enhance yield reward and maintain a stable credit profile while avoiding some of the potentially harmful secular demographic trends presented above.


Disclosures: This is for informational purposes only and is not intended as investment advice or an offer or solicitation with respect to the purchase or sale of any security, strategy or investment product. Although the statements of fact, information, charts, analysis and data in this report have been obtained from, and are based upon, sources Sage believes to be reliable, we do not guarantee their accuracy, and the underlying information, data, figures and publicly available information has not been verified or audited for accuracy or completeness by Sage. Additionally, we do not represent that the information, data, analysis and charts are accurate or complete, and as such should not be relied upon as such. All results included in this report constitute Sage’s opinions as of the date of this report and are subject to change without notice due to various factors, such as market conditions. Investors should make their own decisions on investment strategies based on their specific investment objectives and financial circumstances. All investments contain risk and may lose value. Past performance is not a guarantee of future results.

Sage Advisory Services, Ltd. Co. is a registered investment adviser that provides investment management services for a variety of institutions and high net worth individuals. For additional information on Sage and its investment management services, please view our web site at www.sageadvisory.com, or refer to our Form ADV, which is available upon request by calling 512.327.5530.


Now is the Time to Reduce BBB Credit Risk to Protect Against Principle Loss

by Jeffrey Timlin

Due to an extremely strong technical environment, municipal yields have experienced a significant decline from the highs of 2018. In addition, credit spreads have tightened to historic lows and offer limited income reward relative to the risk of principal loss. A powerful portfolio management tool that Sage utilizes to optimize risk and reward characteristics is spread valuation analysis. In a historically wide spread environment, Sage would be allocating a larger percentage of the portfolio to lower-rated credits, due to the advantageous income environment. Alternatively, when spreads are near their historic low, Sage will reduce exposure to lower-rated credits to lock in positive returns as well as protect against principal loss.

As show in the chart, the additional spread that municipal investors are offered for owning BBB-rated bonds over Single A-rated bonds is currently 70 bps. Although this may seem attractive from a yield/income perspective, the probability of principle loss remains elevated.


Source: Bloomberg


As an example, let’s take a generic BBB-rated bond with a five-year maturity, a 5.00% coupon and a four-year duration. If BBB spreads quickly revert to the 94-basis point average (shown in gray), the principle loss relative to a comparable A-rated bond would almost be 1.00%. However, if BBB bonds trade back towards the upper end of their historic range (127 bps shown in red), the principle loss under this scenario would be approximately 2.25%. For an investor looking to reduce credit risk and who can accept a slight-to-modest reduction in income, reducing exposure to BBB bonds and swapping into higher-rated credits seems like an advantageous tactical trade until the technical environment normalizes.


Disclosures: This is for informational purposes only and is not intended as investment advice or an offer or solicitation with respect to the purchase or sale of any security, strategy or investment product. Although the statements of fact, information, charts, analysis and data in this report have been obtained from, and are based upon, sources Sage believes to be reliable, we do not guarantee their accuracy, and the underlying information, data, figures and publicly available information has not been verified or audited for accuracy or completeness by Sage. Additionally, we do not represent that the information, data, analysis and charts are accurate or complete, and as such should not be relied upon as such. All results included in this report constitute Sage’s opinions as of the date of this report and are subject to change without notice due to various factors, such as market conditions. Investors should make their own decisions on investment strategies based on their specific investment objectives and financial circumstances. All investments contain risk and may lose value. Past performance is not a guarantee of future results.

Sage Advisory Services, Ltd. Co. is a registered investment adviser that provides investment management services for a variety of institutions and high net worth individuals. For additional information on Sage and its investment management services, please view our web site at www.sageadvisory.com, or refer to our Form ADV, which is available upon request by calling 512.327.5530.

Putting Trade into Context: Sage’s Outlook on Emerging Markets

For over a year, U.S.-China trade tensions have seized investor sentiment and dominated headlines. While tariffs and a potential resolution to the current episode are important for near-term price action, it’s only one piece of the puzzle. At Sage, we take a broader view on China and trade to determine our outlook for Asia and its effect on emerging markets (EM).

The fundamental issue facing global growth is that the source of China’s economic growth is changing. The country is shifting its growth model from one of exports and fixed investment spending to consumption-led growth. Officials have attempted to rein in China’s debt levels from the high credit growth of the past 15 years, which should result in a lower, but sustainable rate of growth. U.S. exports are a relatively small contribution to Chinese GDP, and the risk of trade tensions has been more about how it could affect business and investor sentiment than the impact on economic growth. The threat of tariffs was a catalyst for last year’s EM selloff, but those risks have been mitigated given a potential trade agreement between the U.S. and China in the coming months.

When we look past trade tensions, the underlying issue is that the Chinese economy is in a material slowdown. The chart below shows global manufacturing activity as measured by the Purchasing Managers’ Index, a common leading economic indicator. Chinese manufacturing activity has slowed to a level that indicates an economic contraction.


Chinese policymakers have responded with fiscal stimulus but have yet to introduce a liquidity injection to boost the property sector, which was China’s playbook for 2016. While the recent stimulus measures will help, its “impulse,” the effect that it will have on the Chinese economy, may not materialize for six or more months.

China is a huge trading partner to other EM countries, such as Taiwan and Korea, and recent figures from those countries have shown the magnitude of the Chinese slowdown.


In addition, commodity exporters, such as Chile, Australia, South Africa, and Brazil, have seen exports decline in recent months. These export numbers are a bellwether to growth in Asia and have the potential to hurt investor sentiment for EM assets.

Given recent strength in EM equities, particularly China, we have decided to underweight emerging markets throughout our equities, fixed income, and asset allocation strategies. The risk to this view is twofold: 1) flows moving into China due to index inclusion (MSCI) and investor demand, and 2) the economy responding positively to recent stimulus or a trade agreement in the near term (0-6 months). Ultimately, we believe these outcomes are improbable given the rapid buildup of flows and the current extreme positive sentiment surrounding EM assets.


The source for both charts are Bloomberg and Sage, as of 3/13/19.

Disclosures: This is for informational purposes only and is not intended as investment advice or an offer or solicitation with respect to the purchase or sale of any security, strategy or investment product. Although the statements of fact, information, charts, analysis and data in this report have been obtained from, and are based upon, sources Sage believes to be reliable, we do not guarantee their accuracy, and the underlying information, data, figures and publicly available information has not been verified or audited for accuracy or completeness by Sage. Additionally, we do not represent that the information, data, analysis and charts are accurate or complete, and as such should not be relied upon as such. All results included in this report constitute Sage’s opinions as of the date of this report and are subject to change without notice due to various factors, such as market conditions. Investors should make their own decisions on investment strategies based on their specific investment objectives and financial circumstances. All investments contain risk and may lose value. Past performance is not a guarantee of future results.

Sage Advisory Services, Ltd. Co. is a registered investment adviser that provides investment management services for a variety of institutions and high net worth individuals. For additional information on Sage and its investment management services, please view our web site at www.sageadvisory.com, or refer to our Form ADV, which is available upon request by calling 512.327.5530.

A Reason to Love the MTA

Due in part to ongoing fiscal challenges, New York’s Metropolitan Transportation Authority (MTA) bonds are currently trading at attractive levels. At 55 bps over comparable AAA bonds, 10-year MTA bonds rated A1 by Moody’s offers investors an opportunity to pick up some additional yield without significant credit risk.

As one the oldest and largest transportation networks in the U.S., the authority remains a vital part of New York’s infrastructure and an essential component of commuting for New York, New Jersey, and Connecticut residents. Despite structural deficiencies, Governor Andrew Cuomo, Mayor Bill de Blasio, and many other local leaders are heavily invested in the ongoing success of the MTA. A recent 10-Point Plan to transform and fund the MTA has significant support from both parties. For those who can handle modest credit risk and a bit of spread volatility, MTA bonds offer a good entry point.

As shown below, by selling out of 10 Yr AAA Georgia State GOs (cusip 373385CN) at a 2.17% yield and purchasing 10 Yr A1 MTAs (cusip 59261APZ) at a 2.72% yield, an investor can capture 55 bps of additional income with the same duration/interest rate risk.


Disclosures: This is for informational purposes only and is not intended as investment advice or an offer or solicitation with respect to the purchase or sale of any security, strategy or investment product. Although the statements of fact, information, charts, analysis and data in this report have been obtained from, and are based upon, sources Sage believes to be reliable, we do not guarantee their accuracy, and the underlying information, data, figures and publicly available information has not been verified or audited for accuracy or completeness by Sage. Additionally, we do not represent that the information, data, analysis and charts are accurate or complete, and as such should not be relied upon as such. All results included in this report constitute Sage’s opinions as of the date of this report and are subject to change without notice due to various factors, such as market conditions. Investors should make their own decisions on investment strategies based on their specific investment objectives and financial circumstances. All investments contain risk and may lose value. Past performance is not a guarantee of future results.

Sage Advisory Services, Ltd. Co. is a registered investment adviser that provides investment management services for a variety of institutions and high net worth individuals. For additional information on Sage and its investment management services, please view our web site at www.sageadvisory.com, or refer to our Form ADV, which is available upon request by calling 512.327.5530.

Consumer Staples is No Longer a Safe Harbor for Bond Investors

Not so long ago, Consumer Staples was one of the safest sectors for corporate bond investors. The sector was filled with companies that were known for steady growth and strong margins. They produced items that consumers wanted no matter the state of the economy, including cigarettes, beer, and classic food items like soup, pretzels, and cookies.  The sector may not have always been the most cutting-edge, but investors could count on the issuers in the Consumer Staples sector to deliver consistent cash flows that made buying their debt relatively less risky.  Secular declines in demand for some of these products, combined with more aggressive financial policies spurred by a wave of consolidation have conspired to destroy this narrative. Investors have taken notice. Once one of the “tighter” trading sectors of the corporate bond market, Consumer Staples companies now have spreads that are in line or, in many cases, even wider than other companies in traditionally more volatile sectors, such as Energy and Technology.


The two major phenomena that have pushed spreads wider in this sector are, of course, related: waning product demand and heightened M&A activity. Health awareness has contributed to slowing sales growth in alcohol, cigarettes, and sugary soft drinks. Sales growth has declined significantly for some companies, forcing many corporate management teams to reevaluate their options for producing the profit growth that equity investors demand.


To increase profits, one option that has become increasingly popular with the C-suite executives of these companies is leveraging M&A transactions.  Companies have looked to buy smaller competitors with faster-growing products or combined with similarly-sized peers, adding debt on top of the balance sheet while trying to cut costs via elimination of redundancies. These efforts have had mixed results at best, and at worst have taken long-time blue-chip debt issuers from the being considered stable investment grade outfits to the precipice of junk bond territory.

A high-profile example of this type of failure is the combination of Kraft Foods and H.J. Heinz Co. into The Kraft Heinz Company (KHC). Since the leveraged merger took place in 2015, the combined company’s stock has lost 50% of its value and the entity’s bond ratings have sunken to low BBB, one step away from a junk rating.  The deal had the backing of an impressive roster of investors, including Warren Buffett, who believed in the long-term demand for the products they sold and the company’s ability to cut costs and drive cash flow growth enough to trim the large debt burden created by the merger.

Sage follows a universe of benchmark issuers within the Consumer Staples space that echoes this story. Many issuers are carrying significantly larger debt balances while seeing slowing top-line revenue growth. The group has seen average leverage increase from 2.5x in 2015, to 3.2x currently, especially significant given that traditionally the 3x leverage level was a considered a key guidepost for the difference between an investment grade and a high-yield rating from Moody’s or S&P.


At Sage, we have become less sanguine on the prospects for the Consumer Staples sector at large, and within the sector we prefer lower-risk credits that have avoided the temptation to issue excessive debt for mergers designed to spur sales growth. Clorox (CLX) and Colgate-Palmolive (CL) exemplify this discipline, while companies such as Kraft-Heinz, Campbell Soup Co. (CPB), and Anheuser-Busch InBev (BUD) have all the characteristics we’d prefer to avoid.


The source on all charts is Bloomberg.

Disclosures: This is for informational purposes only and is not intended as investment advice or an offer or solicitation with respect to the purchase or sale of any security, strategy or investment product. Although the statements of fact, information, charts, analysis and data in this report have been obtained from, and are based upon, sources Sage believes to be reliable, we do not guarantee their accuracy, and the underlying information, data, figures and publicly available information has not been verified or audited for accuracy or completeness by Sage. Additionally, we do not represent that the information, data, analysis and charts are accurate or complete, and as such should not be relied upon as such. All results included in this report constitute Sage’s opinions as of the date of this report and are subject to change without notice due to various factors, such as market conditions. Investors should make their own decisions on investment strategies based on their specific investment objectives and financial circumstances. All investments contain risk and may lose value. Past performance is not a guarantee of future results.

Sage Advisory Services, Ltd. Co. is a registered investment adviser that provides investment management services for a variety of institutions and high net worth individuals. For additional information on Sage and its investment management services, please view our web site at www.sageadvisory.com, or refer to our Form ADV, which is available upon request by calling 512.327.5530.

Looking Beyond Yield in a Multi-Asset Income Strategy

Multi-asset income (MAI) strategies can be an excellent fit for investors who need higher levels of income and have a more moderate risk budget as compared to what a traditional fixed income portfolio may allow. Unfortunately, we are now in the part of the economic cycle where some investors will reach too far for yield without considering the risk of those higher-income markets. Investors seeking income through multi-asset strategies should consider the volatility and correlation to equities of many of these strategies.

While many MAI strategies have boasted equity-like returns during the recovery, they have also come with equity-like volatility. This was evidenced in 2018, as most MAI funds experienced negative returns, similar to equities. Before 2018, the last year there was a spike in volatility was 2015; MAI funds also struggled that year. The reason is that most MAI strategies rely heavily on high-dividend equities and equity-like markets, such as preferred stocks, high-yield, and alternative fixed income (such as MLPs). This is appropriate to generate higher yields, but if it’s not balanced with an allocation to core high-quality fixed income and managed with overall risk level and volatility in mind, it will lead to a large drawdown in risk-off markets and a high correlation to equities.


We believe that for income-focused investors, large drawdowns and high correlations to equities are unacceptable. Sage’s MAI strategy is managed on a yield-to-volatility concept, where we measure the attractiveness of an income-generating market not by yield alone, but also by its ratio of yield-to-volatility. This ensures we are not gravitating too strongly toward high-income markets with rising volatility or “reaching for yield” in an environment of increasing risks.


At Sage we manage the portfolio with a “risk budget,” so our portfolio’s volatility is closer to a fixed income index than an equity index. This ensures that our portfolios are always well diversified, have a core allocation to high-quality fixed income, and act more like a fixed income portfolio in volatile markets than an equity portfolio. While this approach puts us on the more conservative side of the typical MAI strategy, we will gladly sacrifice modest levels of income and return in bull markets for a more soundly constructed income allocation. In the long run, it’s Sage’s MAI strategy is about 1) generating consistent income without the risk of giving years’ worth of that income back in one drawdown, and 2) providing clients a smooth ride along the way.


Disclosures: This is for informational purposes only and is not intended as investment advice or an offer or solicitation with respect to the purchase or sale of any security, strategy or investment product. Although the statements of fact, information, charts, analysis and data in this report have been obtained from, and are based upon, sources Sage believes to be reliable, we do not guarantee their accuracy, and the underlying information, data, figures and publicly available information has not been verified or audited for accuracy or completeness by Sage. Additionally, we do not represent that the information, data, analysis and charts are accurate or complete, and as such should not be relied upon as such. All results included in this report constitute Sage’s opinions as of the date of this report and are subject to change without notice due to various factors, such as market conditions. Investors should make their own decisions on investment strategies based on their specific investment objectives and financial circumstances. All investments contain risk and may lose value. Past performance is not a guarantee of future results.

Sage Advisory Services, Ltd. Co. is a registered investment adviser that provides investment management services for a variety of institutions and high net worth individuals. For additional information on Sage and its investment management services, please view our web site at www.sageadvisory.com, or refer to our Form ADV, which is available upon request by calling 512.327.5530.

February Equities Outlook in 5 Charts

1. The U.S. consumer remains a bright spot amid slowing economic activity abroad and a cooling U.S. corporate sector.


2. Equity indices have recovered the bulk of their losses from the fourth quarter and valuations appear fair. Given a more challenging macro picture, fixed income has become the more attractive asset class.


3. Some sectors, such as Tech and Industrials, have reaped strong year-to-date returns. Given continued volatility and slowing trends, this has created a case for more defensive sectors.


4. Political risks and slowing economic data has created a tepid view toward developed international markets versus the U.S.; however, markets have already discounted much of this risk.


5. Sentiment toward emerging markets equities turned positive in mid-2018, and investors continue to show confidence in the region due to a more dovish rate environment and expectations for further stimulus from China.


The source for all charts is Bloomberg.


Disclosures: This is for informational purposes only and is not intended as investment advice or an offer or solicitation with respect to the purchase or sale of any security, strategy or investment product. Although the statements of fact, information, charts, analysis and data in this report have been obtained from, and are based upon, sources Sage believes to be reliable, we do not guarantee their accuracy, and the underlying information, data, figures and publicly available information has not been verified or audited for accuracy or completeness by Sage. Additionally, we do not represent that the information, data, analysis and charts are accurate or complete, and as such should not be relied upon as such. All results included in this report constitute Sage’s opinions as of the date of this report and are subject to change without notice due to various factors, such as market conditions. Investors should make their own decisions on investment strategies based on their specific investment objectives and financial circumstances. All investments contain risk and may lose value. Past performance is not a guarantee of future results.

Sage Advisory Services, Ltd. Co. is a registered investment adviser that provides investment management services for a variety of institutions and high net worth individuals. For additional information on Sage and its investment management services, please view our web site at www.sageadvisory.com, or refer to our Form ADV, which is available upon request by calling 512.327.5530.


February Fixed Income Outlook in 5 Charts

1. By pausing rate hikes and slowing quantitative tightening, the Federal Reserve has supported equities and other risk assets; valuations have since moved back to fair territory after the January rally. This chart illustrates how the Fed’s policy reactions have corresponded with the direction of equity markets.


2. The fourth quarter provided an excellent opportunity to add credit exposure as markets became too aggressive in pricing in recession concerns. Supportive technical indicators and higher yields suggest credit has further room to outperform.


3. Downward pressure on rates caused by a more dovish Fed and weakening global growth is being offset by continued balance sheet runoff and moderate growth in the U.S. Rates are likely to be rangebound in the near-term.


4. A strong housing market coupled with a rangebound outlook for interest rates are supportive of an allocation to mortgage pass-throughs.


5. Bullish sentiment, yield carry, and valuation data suggest now is the time to hold an allocation to select non-core fixed income sectors, such as emerging markets.


The source for all charts is Bloomberg.

Disclosures: This is for informational purposes only and is not intended as investment advice or an offer or solicitation with respect to the purchase or sale of any security, strategy or investment product. Although the statements of fact, information, charts, analysis and data in this report have been obtained from, and are based upon, sources Sage believes to be reliable, we do not guarantee their accuracy, and the underlying information, data, figures and publicly available information has not been verified or audited for accuracy or completeness by Sage. Additionally, we do not represent that the information, data, analysis and charts are accurate or complete, and as such should not be relied upon as such. All results included in this report constitute Sage’s opinions as of the date of this report and are subject to change without notice due to various factors, such as market conditions. Investors should make their own decisions on investment strategies based on their specific investment objectives and financial circumstances. All investments contain risk and may lose value. Past performance is not a guarantee of future results.

Sage Advisory Services, Ltd. Co. is a registered investment adviser that provides investment management services for a variety of institutions and high net worth individuals. For additional information on Sage and its investment management services, please view our web site at www.sageadvisory.com, or refer to our Form ADV, which is available upon request by calling 512.327.5530.