The 2020 Presidential Election and Markets – 5 Things Investors Need to Know

by Rob Williams, Director of Research

We expect the continued economic recovery to be a driver of market returns overall and putting the uncertainty of elections behind us will be positive for risk assets such as equities. In the meantime, as we enter the height of election season, investors should consider how the following factors will affect markets.

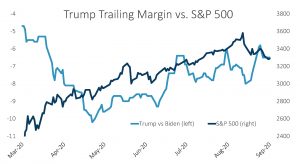
1) Expect a tight race and continued volatility. Biden maintains a lead over Trump in the voting polls, but the lead has shrunk as the economic recovery gained momentum and markets moved higher.


Source: Bloomberg

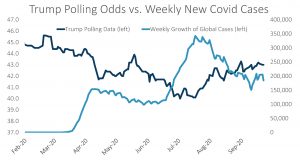
Trump’s polling gap is highly dependent on Covid-19 cases. Recent market volatility and an uptick in new cases is likely to keep Trump trailing into the election, but close enough to keep results highly uncertain.

Source: Bloomberg

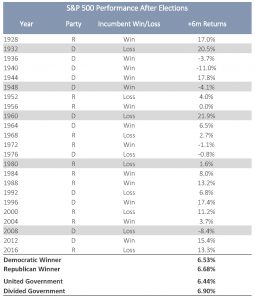
2) Historical data is a mixed bag. Historical election and market return data tells us that immediate post-election market returns have not favored either party; both parties have had strong positive and negative return regimes over both short and longer periods. While the incumbent president has typically had the advantage, 13 vs. 10 wins, this is not so during recessions, where the incumbent has lost 4 out of 5 times.


Source: Bloomberg
 

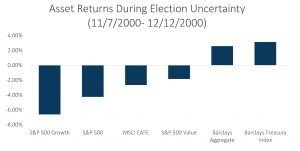
3) Contested results will cause market volatility. A contested election/delayed results is something investors should be considering and would likely result in at least a temporary risk-off scenario. The 2000 election is the nearest example we have of a delayed result, when the Supreme Court ultimately halted recounts and declared a winner. The result of the uncertainty was lower interest rates and weaker equities, with performance favoring international, value-oriented equities and longer-duration fixed income.

Source: Bloomberg

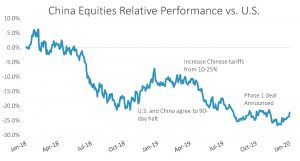
4) Trade policy will be impactful and doesn’t depend on either party controlling Congress. The handling of trade policy will be one of the key differences between candidates and doesn’t require a shift in Congress to be implemented. Harsh rhetoric and tariffs during the China/U.S. trade war weighed on international returns, especially China and emerging market Asia. Status quo results may continue to favor the U.S., while a Biden victory could bolster relative international returns.

Source: Bloomberg

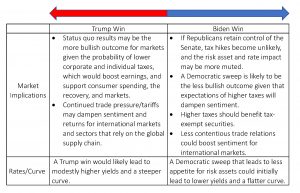
5) Both parties will focus on pro-growth policies, and the Fed will be the more important driver of interest rates. The following table provides color on how markets would respond depending on the winning candidate.

Source: Bloomberg


Disclosures: This is for informational purposes only and is not intended as investment advice or an offer or solicitation with respect to the purchase or sale of any security, strategy or investment product. Although the statements of fact, information, charts, analysis and data in this report have been obtained from, and are based upon, sources Sage believes to be reliable, we do not guarantee their accuracy, and the underlying information, data, figures and publicly available information has not been verified or audited for accuracy or completeness by Sage. Additionally, we do not represent that the information, data, analysis and charts are accurate or complete, and as such should not be relied upon as such. All results included in this report constitute Sage’s opinions as of the date of this report and are subject to change without notice due to various factors, such as market conditions. Investors should make their own decisions on investment strategies based on their specific investment objectives and financial circumstances. All investments contain risk and may lose value. Past performance is not a guarantee of future results.

Sage Advisory Services, Ltd. Co. is a registered investment adviser that provides investment management services for a variety of institutions and high net worth individuals. For additional information on Sage and its investment management services, please view our web site at www.sageadvisory.com, or refer to our Form ADV, which is available upon request by calling 512.327.5530.


Notes From the Desk – Credit Spread Dispersion Between Cyclical and Non-Cyclical Industries Reveals Opportunities

As summer draws to a close, the U.S. economy continues to stage a dramatic recovery. While equities have responded by powering through all-time highs, corporate credit spreads flatlined in August. The level of spreads tells only one part of the story in credit, however, and they are not reflective of the high level of dispersion that persists within the corporate bond universe, namely among cyclical and non-cyclical sectors. This leads us to believe there are opportunities among select issuers that could lead to additional return over the coming months. Breaking out the corporate universe into cyclicals and non-cyclicals reveals a more nascent recovery in names that were the most adversely affected by COVID-19 in August. Given our macro outlook of continued recovery, we believe credit spreads of consumer cyclical sectors, such as autos and logistics companies, have room to compress toward the overall index spread.

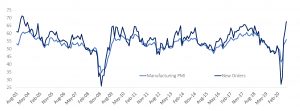
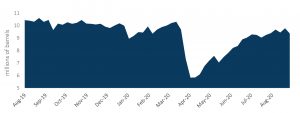
The most recent slate of economic data paints a picture of a V-shaped recovery as supply chains come back online, particularly in the consumer goods sector. Manufacturing PMIs have recovered above pre-COVID-19 levels and new orders are at a 16-year high. Additionally, gasoline demand has recovered to pre-COVID-19 levels, signaling a return to mobility after widespread lockdown and an increase in the flow of goods in the economy. These data points along with several others, including housing, autos, and trade activity, supports our view of a continued recovery in the coming months.

Manufacturing PMI/New Orders

Source: Bloomberg

Gasoline Demand

Source: Department of Energy, Bloomberg

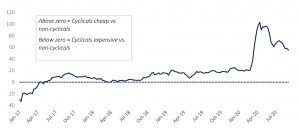
Turning to credit valuations, we believe a strong rebound in economic data will create a tailwind for the consumer cyclical sectors within the corporate bond universe. The current spread differential of consumer cyclical versus non-cyclical sectors recently touched a multi-year high and has only recently displayed signs of compressing tighter after pausing in mid-June due to fears of a COVID-19 second wave.

Spread Differential, Consumer Cyclicals vs. Non-Cyclical Corporate Bonds

Source: Sage, Bloomberg

Although overall valuations of the corporate bond universe have rebounded from March lows, we believe that when one looks “under the hood,” select consumer cyclical sectors, such as autos and logistics companies, have room to rally on an absolute basis and relative to non-cyclical sectors. To that end, we have initiated overweight positions in issuers within those industries.


Download the full post here.


Disclosures: This is for informational purposes only and is not intended as investment advice or an offer or solicitation with respect to the purchase or sale of any security, strategy or investment product. Although the statements of fact, information, charts, analysis and data in this report have been obtained from, and are based upon, sources Sage believes to be reliable, we do not guarantee their accuracy, and the underlying information, data, figures and publicly available information has not been verified or audited for accuracy or completeness by Sage. Additionally, we do not represent that the information, data, analysis and charts are accurate or complete, and as such should not be relied upon as such. All results included in this report constitute Sage’s opinions as of the date of this report and are subject to change without notice due to various factors, such as market conditions. Investors should make their own decisions on investment strategies based on their specific investment objectives and financial circumstances. All investments contain risk and may lose value. Past performance is not a guarantee of future results.

Sage Advisory Services, Ltd. Co. is a registered investment adviser that provides investment management services for a variety of institutions and high net worth individuals. For additional information on Sage and its investment management services, please view our web site at www.sageadvisory.com, or refer to our Form ADV, which is available upon request by calling 512.327.5530.

A Tipping Point in ESG ETFs?

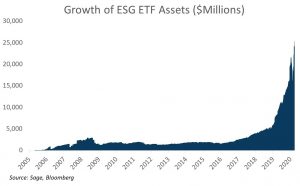
Environmental, Social, and Governance (ESG)-oriented ETFs took off in 2005 with the launch of the iShares MSCI USA ESG Select ETF, with a little over $20 million in assets. It took 14 years for ESG ETF assets to reach $5 billion, and just 18 more months to get to $25 billion. What happened?

Sustainable investing has been around for decades but it was initially focused on pockets of the investment ecosystem, did not have widespread adoption, and was mainly focused on strategies that excluded areas of the markets that didn’t align with the investors’ values. It was about five years ago that large institutional investors began to consider ESG, media coverage increased, and the growth of standardized ESG data contributed to the adoption of ESG into the investment mainstream. At that time, there were two main questions with regard to ESG investing:

  • First, will all the buzz around ESG result in asset flows?
  • Second, by adopting a sustainable investment strategy, does the investor forgo return relative to a conventional strategy?

In this Perspectives piece, we use ETF flow and performance data from the past 12 months to give clarity on flows into ESG investments, which have gained steam in 2020 and could be foreshadowing a tipping point for flows into ESG strategies. As an example, while ESG-oriented ETFs represent only 0.8% of the $6 trillion of U.S.-listed equity ETFs, they have accounted for over 30% of ETF inflows thus far in 2020!

We also highlight performance – an ESG strategy does not result in inferior returns versus a conventional index. In fact, over the past 12 months – in which we’ve seen equities make all-time highs as well as the fastest bear market in history — ESG strategies have largely outperformed the most popular conventional passive ETFs.

Ultimately, we believe the acceleration in flows into ESG ETF assets are a result of three factors: first, the continued trend toward values-based investing, which has been spurred further by the COVID-19 and oil crises this year. Second, the breadth of investment options has reached critical mass – the average investor now can access most public asset classes through ETFs. Lastly, investors have been able to observe the performance of ESG ETFs through historic bear and bull markets in the last three years alone, and the returns so far have been favorable to ESG strategies relative to conventional passive indexes and ETFs.

Fund Flows – The Hype is Real

The inflow of funds into ESG ETFs, primarily in equities, has picked up steam in the past 12 months to an AUM base of $25.2 billion as of April 30, 2020. Just to put that into perspective, it took ESG ETFs a little under two years to go from zero to $1 billion in assets, 12 more years to reach $5 billion in assets, and then just 18 months to reach a $25 billion AUM mark! The chart below shows the growth of ESG ETF assets over time.

The recent wave of asset flows has been concentrated in equities, which account for the bulk of the ETF equity flows thus far in 2020. The table below shows flows of ESG ETFs versus the larger ETF universe in both equities and fixed income. While ESG Equity ETFs represent 0.8% of total equity ETF assets, they have accounted for over 30% of all equity ETF flows thus far in 2020!

The ESG fixed income space tells a different story. In 2020, fixed income ESG ETF inflows have remained modest. We believe that the slower adoption of fixed income relative to equity ETFs is to be expected as the ETF market in fixed income is smaller in terms of assets and the number of ETFs. However, as ESG investing continues to pick up steam as we have seen in equities, we believe that most asset classes and fund types should benefit from this trend.

ESG Performance – Through Thick and Thin

Investors now have enough of a sample size to judge how ESG-oriented strategies perform in both euphoric bull markets and deep bear markets. The past three years in markets have alternated between a low volatility rally in 2017, a sharp drawdown in the fourth quarter of 2018, one of the best years for equity markets in 2019, and the fastest bear market in history in 1Q 2020 during the COVID-19 crisis. It truly has been an interesting “laboratory environment” for an investment strategy, and ESG thus far has shown robustness across different market environments.

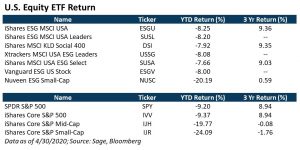
In the tables below, we examine performance of the largest segment of ESG ETF assets, U.S. equities, versus the largest passive ETFs to gauge performance during those time periods. We found that ESG not only has kept up with conventional indexes, it has also been able to outperform, which we believe is a big reason for the recent inflows into the ESG category.

The table below displays the performance of some of the largest ESG Equity ETFs as well as the largest passive ETFs of conventional indexes in equities. On a YTD basis, the ESG ETFs have outperformed the largest S&P 500 ETFs, and even the Nuveen ESG Small Cap ETF, an ESG-oriented U.S. equity strategy, has outperformed the largest U.S. Small Cap ETF on a YTD and three-year basis.

In observing the recent performance of ESG strategies, investors are recognizing the advantages of a company with superior sustainability characteristics. A company that implements material ESG principles is often associated with properties of a “high-quality” company as defined in quantitative investing parlance: profitability, low volatility, and stable earnings. These properties of companies are rewarded by markets over time, especially during late-cycle environments and recessionary time periods.

A Sign of Things to Come – Growth Opportunities

In his bestselling book The Tipping Point, author Malcolm Gladwell defines a tipping point of a social trend as the following:

The tipping point is that magic moment when an idea, trend, or social behavior crosses a threshold, tips, and spreads like wildfire.

The discussion, anticipation, and importance of ESG over the past five years has seen a follow through in asset flows, and like many of the examples in Gladwell’s book, once a concept crosses the “threshold,” change happens rapidly, not gradually.

Sage is fully committed to the growth of ESG. We provide investors with ESG ETF models, an ESG corporate bond ETF (GUDB), and ESG fixed income strategies. As ESG remains a small fraction of the ETF and separate account markets, we see the most potential for growth in two main areas. First, ESG fixed income strategies, which are picking up flows but not to the scale of equity strategies, could see the same growth trajectory as equity ETF assets as fixed income funds continue to build a track record. Additionally, there is room for growth for ESG ETFs within the defined contribution space, where there is a dearth of ESG options in most 401(k) plans. With the millennial generation now becoming the largest investment cohort, the 401(k) choice architecture should evolve with the demographics and include more ESG strategies.


Disclosures: This is for informational purposes only and is not intended as investment advice or an offer or solicitation with respect to the purchase or sale of any security, strategy or investment product. Although the statements of fact, information, charts, analysis and data in this report have been obtained from, and are based upon, sources Sage believes to be reliable, we do not guarantee their accuracy, and the underlying information, data, figures and publicly available information has not been verified or audited for accuracy or completeness by Sage. Additionally, we do not represent that the information, data, analysis and charts are accurate or complete, and as such should not be relied upon as such. All results included in this report constitute Sage’s opinions as of the date of this report and are subject to change without notice due to various factors, such as market conditions. Investors should make their own decisions on investment strategies based on their specific investment objectives and financial circumstances. All investments contain risk and may lose value. Past performance is not a guarantee of future results.

Sage Advisory Services, Ltd. Co. is a registered investment adviser that provides investment management services for a variety of institutions and high net worth individuals. For additional information on Sage and its investment management services, please view our web site at www.sageadvisory.com, or refer to our Form ADV, which is available upon request by calling 512.327.5530.
Company Transparency in the Time of COVID-19: An Update on 3M’s Missteps

The N95 mask has become a symbol of the fight against COVID-19. Named for its ability to block 95% of airborne particles, it has become vitally important to protect health care workers fighting deadly viruses. In the wake of the COVID-19 pandemic, N95 masks are in dangerously short supply. Skyrocketing demand and diminishing supply have left health care providers caring for ill patients without protective personal equipment (PPE), such as the N95 masks, gloves, and surgical gowns. Many have reported being forced to ration or reuse PPE. Medical staff have even taken to social media to communicate the intensity of the situation, making #GetMePPE a trending topic. It has been estimated that fighting COVID-19 will require 3.5 billion masks in the U.S. alone.

Earlier this year we published a perspectives piece on 3M’s chemical industry and its involvement with PFAS (per- and polyfluoroalkyl substances) contamination. We called attention to the company’s questionable business ethics that were brought to light when it failed to effectively manage PFAS, leading to a decades-long national health crisis. However, 3M’s chemical branch only makes up less than a third of its revenue. The company has a diverse business model and is also a large producer of medical equipment and supplies, bringing 3M’s name to a multitude of national headlines over these past weeks. While several companies make N95 masks, 3M has a near monopoly on production. Other respirators that work to block 95% of airborne particles exist, but the FDA has only approved N95s for use in the U.S., putting 3M in a unique position of great responsibility.

Mark Cuban, owner of the Dallas Mavericks, has become an unlikely voice in advocating against PPE price gouging. When Cuban began digging into the N95 market, his goal was to get hospital workers the protective equipment they need. Instead, he found his inbox flooded with emails from distributors reselling masks with significant price markups – a normal N95 mask costs anywhere from $0.50-$1 –  Cuban was offered the masks at $8 each. 3M does not sell its masks directly to consumers, but rather uses licensed distributors as middlemen. While 3M has said it will not raise prices for medical equipment, a lack of supply, price consistency, and information have led to a free-for-all among companies wanting to resell the masks. This had led to extreme price gouging, with masks being sold at highly inflated prices – like the ones offered to Mark Cuban. State governors across the U.S. have reported being forced to partake in bidding wars for N95 masks, allowing states that can afford to pay the premium to take home the order.

When asked about distributor price gouging, a representative for 3M has said the company cannot control prices retailers and dealers charge for 3M products. A statement released by the company’s CEO Mike Roman promises that 3M will be working with federal and state governments to prevent price gouging and counterfeiting. Already, 3M has filed multiple lawsuits against those it has found profiteering; however, we find this situation reminiscent of 3M’s management of PFAS; the company has exhibited a stark lack of transparency and has failed to be proactive.

In normal circumstances, there is no reason 3M should not maintain its relationships with mask distributors – but these are not normal times. We believe 3M could have easily required distributors to sell directly to hospitals and health care providers, while threatening to end contracts with distributors who refused. 3M chose not to do so. Instead, for weeks the company sat on the sidelines while distributors increased prices and American health care providers went without PPE.

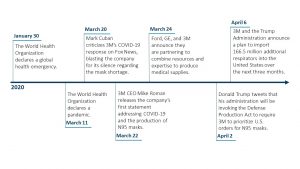
In late March, the Trump Administration invoked the Defense Production Act after it discovered that 3M was still exporting masks to Canada and Latin America. After determining that cutting off mask supplies to other countries would prove detrimental to the United States, 3M and the White House announced that the company will import 166.5 million respirators to the U.S. over the next three months while also continuing to fulfill foreign contracts. While the agreement was amicable, President Trump’s initial public frustration with 3M hurt the company’s brand image and could have been avoided if 3M had chosen to better communicate with the country about what is happening in the N95 mask market.

Beyond Scotchgard and Command Strips, 3M’s participation in the health care industry means the company has a duty to serve its stakeholders during this time to increase production of medical equipment and supplies and prevent price gouging and counterfeiting. 3M has worked to increase N95 capacity, but supply has not met demand and the company has not done enough to effectively combat price gouging. Lack of communication has led to wasted resources and time. We believe the company’s lack of transparency reinforces our view that 3M’s weak corporate governance presents material ESG risks that are unlikely to abate anytime soon.

Timeline of 3M’s Missteps


Disclosures: This is for informational purposes only and is not intended as investment advice or an offer or solicitation with respect to the purchase or sale of any security, strategy or investment product. Although the statements of fact, information, charts, analysis and data in this report have been obtained from, and are based upon, sources Sage believes to be reliable, we do not guarantee their accuracy, and the underlying information, data, figures and publicly available information has not been verified or audited for accuracy or completeness by Sage. Additionally, we do not represent that the information, data, analysis and charts are accurate or complete, and as such should not be relied upon as such. All results included in this report constitute Sage’s opinions as of the date of this report and are subject to change without notice due to various factors, such as market conditions. Investors should make their own decisions on investment strategies based on their specific investment objectives and financial circumstances. All investments contain risk and may lose value. Past performance is not a guarantee of future results.

Sage Advisory Services, Ltd. Co. is a registered investment adviser that provides investment management services for a variety of institutions and high net worth individuals. For additional information on Sage and its investment management services, please view our web site at www.sageadvisory.com, or refer to our Form ADV, which is available upon request by calling 512.327.5530.
 

All Hands on Deck – An Update on COVID-19, Its Effect on Markets, and Our Game Plan

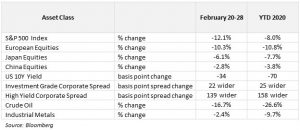
It’s been a long week for the markets. After a respite at the beginning of February, fears around the coronavirus (COVID-19) have devolved into a full-blown panic, resulting in the fastest equity selloff ever. Looking across markets reveals the extent of the turmoil:

A few observations from the last eight trading days:

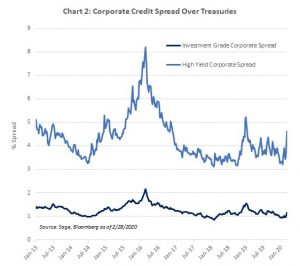
  • U.S. risk assets are leading the down move. The S&P 500 fell into a corrective -10% drawdown in the shortest time period ever. In addition, investment grade corporate credit spreads, which were largely immune to the initial COVID-19 shock in January, widened by 23 basis points to 1.20% over Treasuries. High yield corporate spreads have widened by 112 bps to nearly 5% over Treasuries.
  • Conversely, Chinese equities have outperformed handily during the recent drawdown. Whether it reflects improving conditions in China, or an under-owned region outperforming in a “sell-everything” market, de-risking remains to be seen.
  • Treasury rates continue to make new all-time lows. As of this writing, the U.S. 10Y yield is hovering near 1.15% which is well through the low in yield established during the Brexit Referendum in 2016.

It’s all hands on deck for us at Sage. While we don’t know yet what medium to long-term effects the COVID-19 will have on markets, we do see some areas that could present an opportunity given the extreme fear in the market. Here’s our perspective on various asset classes and the game plan for investing in this environment.

Fixed Income: Interest Rates to Remain Low:

Treasury yields have retreated to make a new all-time low, reflecting COVID-19’s potential impact on the global economy. In January, market consensus treated the effects of the virus as having no more than a 1Q effect on GDP. As the virus continues to spread to more countries, the market has shifted to discounting a much deeper hit to the global economy.

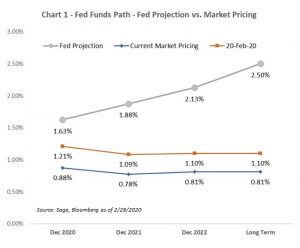
The markets are expecting the Fed to act in response to the virus shock – the Fed Funds market is now anticipating nearly four rate cuts this year (Chart 1) after pricing in just one on February 20th. The Fed’s projection of its rate path, which hasn’t been updated since December, now looks far different than market pricing. Market participants will certainly pay close attention to future Fed communications.

Given the uncertainty in the market, continued flows into high quality fixed income, and potential policy easing, we expect yields to remain low, or even move lower from here. We are maintaining a longer duration across our fixed income strategies.

Credit spreads have widened in kind with the equity selloff, albeit its move isn’t as extreme when compared to recent history. The corporate bond markets are still adjusting to the risk to global growth from historically low spread levels (Chart 2). Conversely, at ultra-low Treasuries yields, corporate credit and other spread sectors now present an interesting yield advantage versus low Treasury yields. To that end, we are carrying a relatively low level of corporate credit risk across most strategies, leaving room to add to credit in the case that the narrative on COVID-19 changes for the better and/or take advantage of dislocations that occur during a panic sell-off.

Equities/Multi-Asset Strategies:

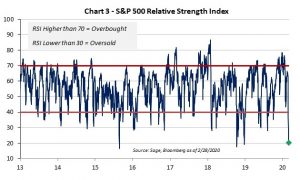
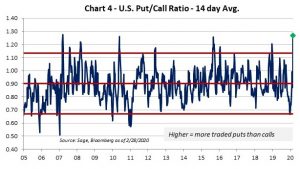
Ahead of the most recent selloff, we lowered equity exposure within the Multi-Asset Income strategies, and reduced beta in our equity allocations. Equity price action during the end of February reflected the public fear around the spread of the COVID-19. The S&P 500 rallied to an all-time high on February 20 then subsequently fell into a corrective 10% drawdown one week later – the fastest descent into a correction, ever. The magnitude of the down move was exacerbated by selling pressure from systematic strategies and retail investors. Two widely followed technical indicators – Relative Strength Index (Chart 3) and Put/Call Ratio (Chart 4) – are at extreme bearish levels which tells us that selling pressure should subside in the near term.

Going Forward: Heightened Market Surveillance & Identifying Value Across Asset Classes

So what now? While we think equity and credit selling pressure should subside in the near-term, uncertainty around the effect of the COVID-19 will remain, along with corresponding market volatility. However, a market environment driven by fear, speculation, and uncertainty could present opportunities to identify mispriced securities, sectors, or asset classes as more information comes to light. We approach this environment with patience and diligence. Within our fixed income portfolios, we remain slightly long duration and carry a relatively low level of credit risk. Within our multi-asset class strategies, we’ve recently lowered equity sensitivities, which allows us to be opportunistic in the case that conditions improve and/or attractive valuations present themselves.

We are closely monitoring the COVID-19 situation and will continue to update you on any changes in market conditions or our perspective.


Disclosures: This is for informational purposes only and is not intended as investment advice or an offer or solicitation with respect to the purchase or sale of any security, strategy or investment product. Although the statements of fact, information, charts, analysis and data in this report have been obtained from, and are based upon, sources Sage believes to be reliable, we do not guarantee their accuracy, and the underlying information, data, figures and publicly available information has not been verified or audited for accuracy or completeness by Sage. Additionally, we do not represent that the information, data, analysis and charts are accurate or complete, and as such should not be relied upon as such. All results included in this report constitute Sage’s opinions as of the date of this report and are subject to change without notice due to various factors, such as market conditions. Investors should make their own decisions on investment strategies based on their specific investment objectives and financial circumstances. All investments contain risk and may lose value. Past performance is not a guarantee of future results.

Sage Advisory Services, Ltd. Co. is a registered investment adviser that provides investment management services for a variety of institutions and high net worth individuals. For additional information on Sage and its investment management services, please view our web site at www.sageadvisory.com, or refer to our Form ADV, which is available upon request by calling 512.327.5530.
Watch for These 6 ESG Trends in 2020

by the Sage ESG Team

1. A greater adoption of ESG.

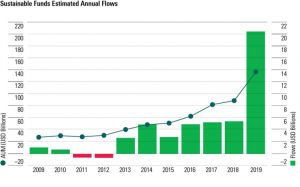
Growth in ESG funds continues to climb. According to Morningstar, net flows to sustainable funds in the U.S. were $20.6 billion in 2019, almost four times the amount of net flows from 2018 of $5.5 billion. There are now 300 ESG open-ended funds and ETFs, up 27% YOY from 236 funds in 2018.

Source: MorningStar Direct, Data as of 12/31/2019


2. Greater results.

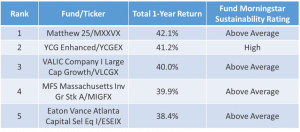
Gone are the days of sacrificing performance to invest in the causes and themes we care about. More people are investing in ESG portfolios because the performance of ESG strategies are competitive with conventional investment products and align to individuals’ values. We call it a double-bottom line. This month, Barron’s reported that in 2019 big-cap equity mutual funds that received a Morningstar sustainability rating of “above average” or “high” outperformed comparable funds with lower sustainability ratings.

Source: Barron’s Morningstar

We are seeing similar results. In 2019, Sage fixed income and equity ESG strategies also outperformed their respective market benchmarks.


3. An increase in products.

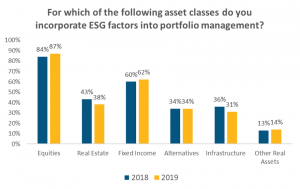
We are seeing new ESG products emerge across the asset allocation spectrum, from 401(k) plans to real estate and alternatives portfolios. Specialty funds on ESG themes have also risen in popularity, such as strategies with increased focus on diversity, with gender emphasis, and a breakout of climate change issues, including fossil-fuel-free funds.

Source: RBC Global Asset Management

At Sage, we expect an increase in the number and types of our product offerings in 2020. Last year, Sage ESG portfolios made their way into cash management and 401(k) plans, providing ESG investment opportunities to plans where there is growing demand but few ESG options.


4. Increased competition.

As more ESG products make their debut, we expect 2020 will be a year of separation in the quality of performance and ESG integration process. There will be heightened scrutiny from SEC, as ESG consideration is increasingly viewed as part of an investor’s fiduciary duty to clients, and institutional consultants will become clearer on their ESG investment requirements. It will be important for each asset manager and each ETF provider to have clear processes in place for how they choose ESG investments. Investors will want to know 1) What is the framework? 2) What is the source of the data? 3) How does it reflect the culture of the firm? 4) what is the client reporting process? 5) how has the strategy performed? Third-party validation from data providers, such as MSCI and Sustainalytics, will matter; the industry will need a referee to say what is truly ESG.

Sage ESG has portfolios that are audited by Sustainalytics semi-annually, because we believe it’s important to our clients to have third-party verification. We also conduct annual stewardship surveys to engage with ETF providers and determine which have practices and policies in place to select the best ESG companies to include in an ETF.


5. Internal ESG policies will matter.

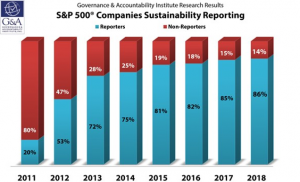
When it comes to choosing an ESG investment manager, internal policies and the “ESG-ness” of the firm will be just as important as its ESG investment holdings. Increasingly, public companies and ESG investment managers are producing annual sustainability reports to measure how their product, services, and people adhere to ESG standards.

In 2018, 86% of the companies in the S&P500 Index published sustainability or corporate responsibility reports.

Source: Governance & Accountability Institute, Inc. 2018 Research – www.ga-institute.com

Additionally, it will be increasingly important for ESG investment managers to affiliate with and support ESG research and reporting organizations, such as MSCI, Sustainalytics, and the Sustainability Accounting Standards Board (SASB), and to seek and hold key certifications, such as the B Corporation designation.

Sage is a member or supporter of all the sustainable organizations that we believe are making the strongest advances in ESG research and reporting. These include Principles for Responsible Investing (PRI), Climate Action 100, The Forum for Sustainable and Responsible Investment (US SIF), Task Force on Climate-Related Financial Disclosures (TCFD), the Sustainability Accounting Standards Board (SASB), and The Green Bond Principles. We also produce and update annually our Sage Responsible Investment Policy in order to provide investors with transparency about how we incorporate ESG factors into our investment process.


6. Clearer reporting.

An emphasis on clear, concise, and consistent reporting will be higher than ever. An increase in the number and types of products will cause confusion in two dimensions: 1) What third-party sources should I pay attention to, and 2) Who is (actually) doing ESG and how do they do it?

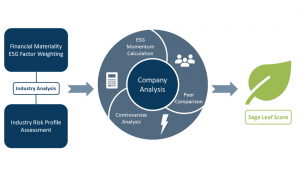
At Sage, we are pragmatic in our ESG investing. Our client reporting includes consistent communication about measurable outcomes. For us, financial materiality and the “G” in ESG will be the focus. Governance will be followed by an emphasis on social and environmental factors, because we believe change starts within the company. This year we will introduce more broadly our Sage ESG Leaf Score, enabling investors to quickly assess ESG performance across companies and industries.

Disclosures: This is for informational purposes only and is not intended as investment advice or an offer or solicitation with respect to the purchase or sale of any security, strategy or investment product. Although the statements of fact, information, charts, analysis and data in this report have been obtained from, and are based upon, sources Sage believes to be reliable, we do not guarantee their accuracy, and the underlying information, data, figures and publicly available information has not been verified or audited for accuracy or completeness by Sage. Additionally, we do not represent that the information, data, analysis and charts are accurate or complete, and as such should not be relied upon as such. All results included in this report constitute Sage’s opinions as of the date of this report and are subject to change without notice due to various factors, such as market conditions. Investors should make their own decisions on investment strategies based on their specific investment objectives and financial circumstances. All investments contain risk and may lose value. Past performance is not a guarantee of future results.

Sage Advisory Services, Ltd. Co. is a registered investment adviser that provides investment management services for a variety of institutions and high net worth individuals. For additional information on Sage and its investment management services, please view our web site at www.sageadvisory.com, or refer to our Form ADV, which is available upon request by calling 512.327.5530.
Notes from the Desk: 3 Reasons Now is the Time to Sell High-Yield

by Ryan O’Malley, Fixed Income Portfolio Strategist

In recent weeks, Sage has become more cautious on lower-quality corporate bonds. Our caution is based on the following signals.

1. Abnormal Performance – High-yield bonds have performed well on an absolute-return basis this year, returning nearly 12% in 2019. Years of double-digit returns for high yield are rare and are typically followed by much weaker returns the following calendar year.

2. Relative Value – High-yield bonds have dramatically outperformed investment grade corporate debt this year, and particularly in the past few months. The spread premium paid by high-yield bonds compared to investment grade bonds has narrowed to its lowest level in 2019 and is near historic lows.

3. Signs of stress in the weakest parts of the market – Despite strong overall performance in the high-yield bond market, there are signs of stress. One such signal is the increase in the number of bonds trading at “distressed” levels. “Distressed” bonds are defined as those issuers who’s spread to the relevant U.S. Treasury exceeds 1,000 basis points, or 10%. The number of bonds trading at “distressed” levels has increased by 63% in the past 12 months.

Sage Positioning

As a result of this changing view, Sage has elected to trim high-yield exposure where we had individual bond positions – taking profits on some longstanding trades, including debt issued by Hilton Worldwide, T-Mobile, Ardagh Group, Cheniere Energy Partners, and Western Digital. Sage has also tactically shifted away from “crossover” credits, or credits that hold investment grade ratings from one agency and high yield from the other.

Investment grade spreads often follow trends in the high-yield markets, so Sage has also shifted its investment grade exposure away from riskier credits and towards higher-quality ones.


*Source on all charts is Bloomberg.


Disclosures: This is for informational purposes only and is not intended as investment advice or an offer or solicitation with respect to the purchase or sale of any security, strategy or investment product. Although the statements of fact, information, charts, analysis and data in this report have been obtained from, and are based upon, sources Sage believes to be reliable, we do not guarantee their accuracy, and the underlying information, data, figures and publicly available information has not been verified or audited for accuracy or completeness by Sage. Additionally, we do not represent that the information, data, analysis and charts are accurate or complete, and as such should not be relied upon as such. All results included in this report constitute Sage’s opinions as of the date of this report and are subject to change without notice due to various factors, such as market conditions. Investors should make their own decisions on investment strategies based on their specific investment objectives and financial circumstances. All investments contain risk and may lose value. Past performance is not a guarantee of future results.

Sage Advisory Services, Ltd. Co. is a registered investment adviser that provides investment management services for a variety of institutions and high net worth individuals. For additional information on Sage and its investment management services, please view our web site at www.sageadvisory.com, or refer to our Form ADV, which is available upon request by calling 512.327.5530.
 

September Equities Outlook in 5 Charts

1. Global growth continues to slow, and the escalation in the trade war, weakness in U.S. data, and politics have increased the probability of a global recession in the next 12 months. The silver lining, at least in the short-term, is that coordinated central bank easing will continue to provide some support to risk assets.

2. We see tactical upside given that sentiment has become very bearish and we are heading into a better seasonal period.

3. Absolute valuations in global equities are not stretched and, relative to bonds, have gotten more attractive with a drop in rates.

4. The U.S. continues to have better growth momentum and earnings momentum versus international markets. Developed markets face less policy flexibility and heightened political challenges, while EM markets face trade headwinds and a persistently strong U.S. dollar.

5. In terms of U.S. sector exposure, we favor an overweight to tech, staples, and REITS.


*The source on all charts are Sage and Bloomberg.

To view our September Fixed Income Outlook in 5 Charts, click here.


Disclosures: This is for informational purposes only and is not intended as investment advice or an offer or solicitation with respect to the purchase or sale of any security, strategy or investment product. Although the statements of fact, information, charts, analysis and data in this report have been obtained from, and are based upon, sources Sage believes to be reliable, we do not guarantee their accuracy, and the underlying information, data, figures and publicly available information has not been verified or audited for accuracy or completeness by Sage. Additionally, we do not represent that the information, data, analysis and charts are accurate or complete, and as such should not be relied upon as such. All results included in this report constitute Sage’s opinions as of the date of this report and are subject to change without notice due to various factors, such as market conditions. Investors should make their own decisions on investment strategies based on their specific investment objectives and financial circumstances. All investments contain risk and may lose value. Past performance is not a guarantee of future results.

Sage Advisory Services, Ltd. Co. is a registered investment adviser that provides investment management services for a variety of institutions and high net worth individuals. For additional information on Sage and its investment management services, please view our web site at www.sageadvisory.com, or refer to our Form ADV, which is available upon request by calling 512.327.5530.

September Fixed Income Outlook in 5 Charts

1. The New York Fed has placed a roughly 40% probability that there will be a recession in the next 12 months.

2. Higher economic risk and lower rate expectations has been positive for high-quality core fixed income, but it is not a good combination for lower-quality spread sectors. Valuations in high yield and other riskier spread sectors are at historically tight levels, offering little cushion in a spread-widening scenario.

3. Correlations to equities among higher-risk fixed income are also at historically high levels, suggesting a greater vulnerability to any risk-off environment.

4. Core fixed income still offers investor diversification benefits vs. equities with negative correlations to equity returns. Using 4Q18 as a recent example – investors reaching for yield too aggressively will be hurt in an equity draw-down scenario.

5. An outlook that includes Fed rate cuts and higher economic risk suggests higher allocations to fixed income. Core fixed income looks the most attractive when weighing risk-adjusted returns with diversification benefits.


*The source on all charts is Bloomberg.

To view our September Equities Outlook in 5 Charts, click here.


Disclosures: This is for informational purposes only and is not intended as investment advice or an offer or solicitation with respect to the purchase or sale of any security, strategy or investment product. Although the statements of fact, information, charts, analysis and data in this report have been obtained from, and are based upon, sources Sage believes to be reliable, we do not guarantee their accuracy, and the underlying information, data, figures and publicly available information has not been verified or audited for accuracy or completeness by Sage. Additionally, we do not represent that the information, data, analysis and charts are accurate or complete, and as such should not be relied upon as such. All results included in this report constitute Sage’s opinions as of the date of this report and are subject to change without notice due to various factors, such as market conditions. Investors should make their own decisions on investment strategies based on their specific investment objectives and financial circumstances. All investments contain risk and may lose value. Past performance is not a guarantee of future results.

Sage Advisory Services, Ltd. Co. is a registered investment adviser that provides investment management services for a variety of institutions and high net worth individuals. For additional information on Sage and its investment management services, please view our web site at www.sageadvisory.com, or refer to our Form ADV, which is available upon request by calling 512.327.5530.

Debatable, Yet Undeniable —Taking Responsibility for Climate Change

by Bob Smith, President & CIO of Sage Advisory

My recent visit to the Arctic was both breathtaking and disturbing. It is a naturalist’s wonderland, offering many opportunities to appreciate and observe the eco diversity of the region. It is also a place where one can see firsthand the growing adverse impact of climate change and mankind upon its inhabitants.

Although it has long been debated as to what extent humans are contributing to climate change and our ability to adapt, what is undeniable is the fact that the earth is getting warmer. The current warming cycle is occurring twice as fast in the Arctic than anywhere else on earth, and it is causing significant changes in the extent, duration, and conditions of sea ice. The loss of sea ice around the Svalbard, an archipelago in the Norwegian Sea, is predicted by scientists to be particularly profound in the coming decades.

These changes affect all life forms in the Arctic but none more so than the iconic polar bear. An apex predator and the largest species of bear on our planet, the polar bear is very much a marine mammal in that it depends upon sea ice as the platform upon which to hunt and breed. This makes the polar bear the one species in the Arctic that is the most vulnerable to climate change because their land, and the crucial natural bounty it provides, is literally melting beneath their paws.

Unlike humans, the polar bear – and importantly, the food chain it tops – are unlikely to adapt. The U.S. Geological Survey projects that two-thirds of polar bears currently in existence will disappear by 2050 as a result of the melting sea ice.

Source: PolarBearHabitat

Melting ice has an obvious external effect on the hunting patterns of polar bears. But polar bears are facing trouble from the inside as well. Unfortunately, due to their high-fat diet of seals and walrus they have become one of the most contaminated beings on Earth. This is because seals and walrus ingest fish and mollusks, which live on micro-organisms baring persistent organic pollutants (POPs). These man-made toxic substances are recognized carcinogens that never degrade and come from distant industrial factories via air and ocean currents.

While I believe everyone is responsible for climate change– from governments to oil and gas producers, to anyone who is dependent on fossil fuels to live their daily lives – there is a responsibility at the corporate level to curb behavior that exacerbates such negative externalities as climate change.

Just as the polar bear is at the height of its food chain, so are two of companies responsible for the creation and widespread use the pollutants contributing to the polar bear’s demise. 3M (MMM), with $33 billion in annual sales, is ranked No. 216 on Forbes’ 2019 list of the world’s largest public companies, and DuPont (DD) is ranked No. 81, with $86 billion in annual sales.

Minnesota-based 3M originally sold two pervasive and now-controversial compounds, PFOA (perfluorooctanoic acid) and PFOS (perfluorooctane sulfonate). PFOA was an integral manufacturing component for nonstick coating product Teflon that was manufactured by Delaware-based DuPont, and PFOS was a key component of the fabric protectant Scotchgard.

Scientists have found more than 200 halogenated harmful contaminants in polar bear blood samples. These contaminants adversely affect the polar bears’ immune systems, hormones, bone density, growth development, and reproductive organs, and they can lead to brain damage.

PFOS production in the United States ceased in 2002, and PFOA were phased out in 2015, the same year DuPont spun off a new company called Chemours (CC) with several of its chemical businesses.  However, PFOA are still widely used internationally and many imported goods, such as textiles and plastics, contain them.  The detrimental effects of these substances released into the environment are long lasting and have led to many lawsuits.

Last year, Minnesota won a $850 million settlement against 3M on the basis that 3M knew about the chemical dangers of these substances and continued to pollute natural resources. And this year, in Michigan, 200 families are suing 3M for contaminating the water. Chemours has sued DuPont, which had been facing 3,500 lawsuits in Ohio over exposure to PFOA, for underestimating the extent of its liabilities.

As a sustainable investment manager, it is my responsibility to enable investors to vote with their dollars and invest in the issues they care about. People can curb climate change and mitigate environmental pollution by voting with their money and investing in companies that have policies in place to limit such negative activities.

One key component of our sustainable investment analysis is whether a company engages in operations that either alienate community members or violate their human rights. So, it is interesting to note that while 3M might score well on some ESG factors, we consider it high risk when factoring in its intentionality.

PFOS and PFOA were replaced by 3M and other companies in the United States with different types of PFAS (per- and polyfluoroalkyl substances) that are said to breakdown faster and be safer overall; however, their relative safety is still being debated. We want to know to what extent did 3M know it was polluting the environment and how long has it continued to do so? These are areas of risk for the company that will affect its long-term financial performance, not only from a legal expense perspective, but from an investor and consumer sentiment perspective. We believe the growing interest in sustainable investing will increase the attention on these issues and as a result, create better corporate citizens that better serve their environment.

When we look at the polar bear, we are reminded that we have a responsibility to ourselves and to our children to do what we can to mitigate the effects of climate change and mankind on the environment. The polar bear’s role as the apex predator in the Arctic puts it at great risk to continue to accumulate toxic levels of man-made pollutants. They are the high Arctic region’s canary in the coal mine, and their growing attrition should be a wake-up call for us all.


Disclosures: This is for informational purposes only and is not intended as investment advice or an offer or solicitation with respect to the purchase or sale of any security, strategy or investment product. Although the statements of fact, information, charts, analysis and data in this report have been obtained from, and are based upon, sources Sage believes to be reliable, we do not guarantee their accuracy, and the underlying information, data, figures and publicly available information has not been verified or audited for accuracy or completeness by Sage. Additionally, we do not represent that the information, data, analysis and charts are accurate or complete, and as such should not be relied upon as such. All results included in this report constitute Sage’s opinions as of the date of this report and are subject to change without notice due to various factors, such as market conditions. Investors should make their own decisions on investment strategies based on their specific investment objectives and financial circumstances. All investments contain risk and may lose value. Past performance is not a guarantee of future results.

Sage Advisory Services, Ltd. Co. is a registered investment adviser that provides investment management services for a variety of institutions and high net worth individuals. For additional information on Sage and its investment management services, please view our web site at www.sageadvisory.com, or refer to our Form ADV, which is available upon request by calling 512.327.5530.