Looking Beyond Yield in a Multi-Asset Income Strategy

Multi-asset income (MAI) strategies can be an excellent fit for investors who need higher levels of income and have a more moderate risk budget as compared to what a traditional fixed income portfolio may allow. Unfortunately, we are now in the part of the economic cycle where some investors will reach too far for yield without considering the risk of those higher-income markets. Investors seeking income through multi-asset strategies should consider the volatility and correlation to equities of many of these strategies.

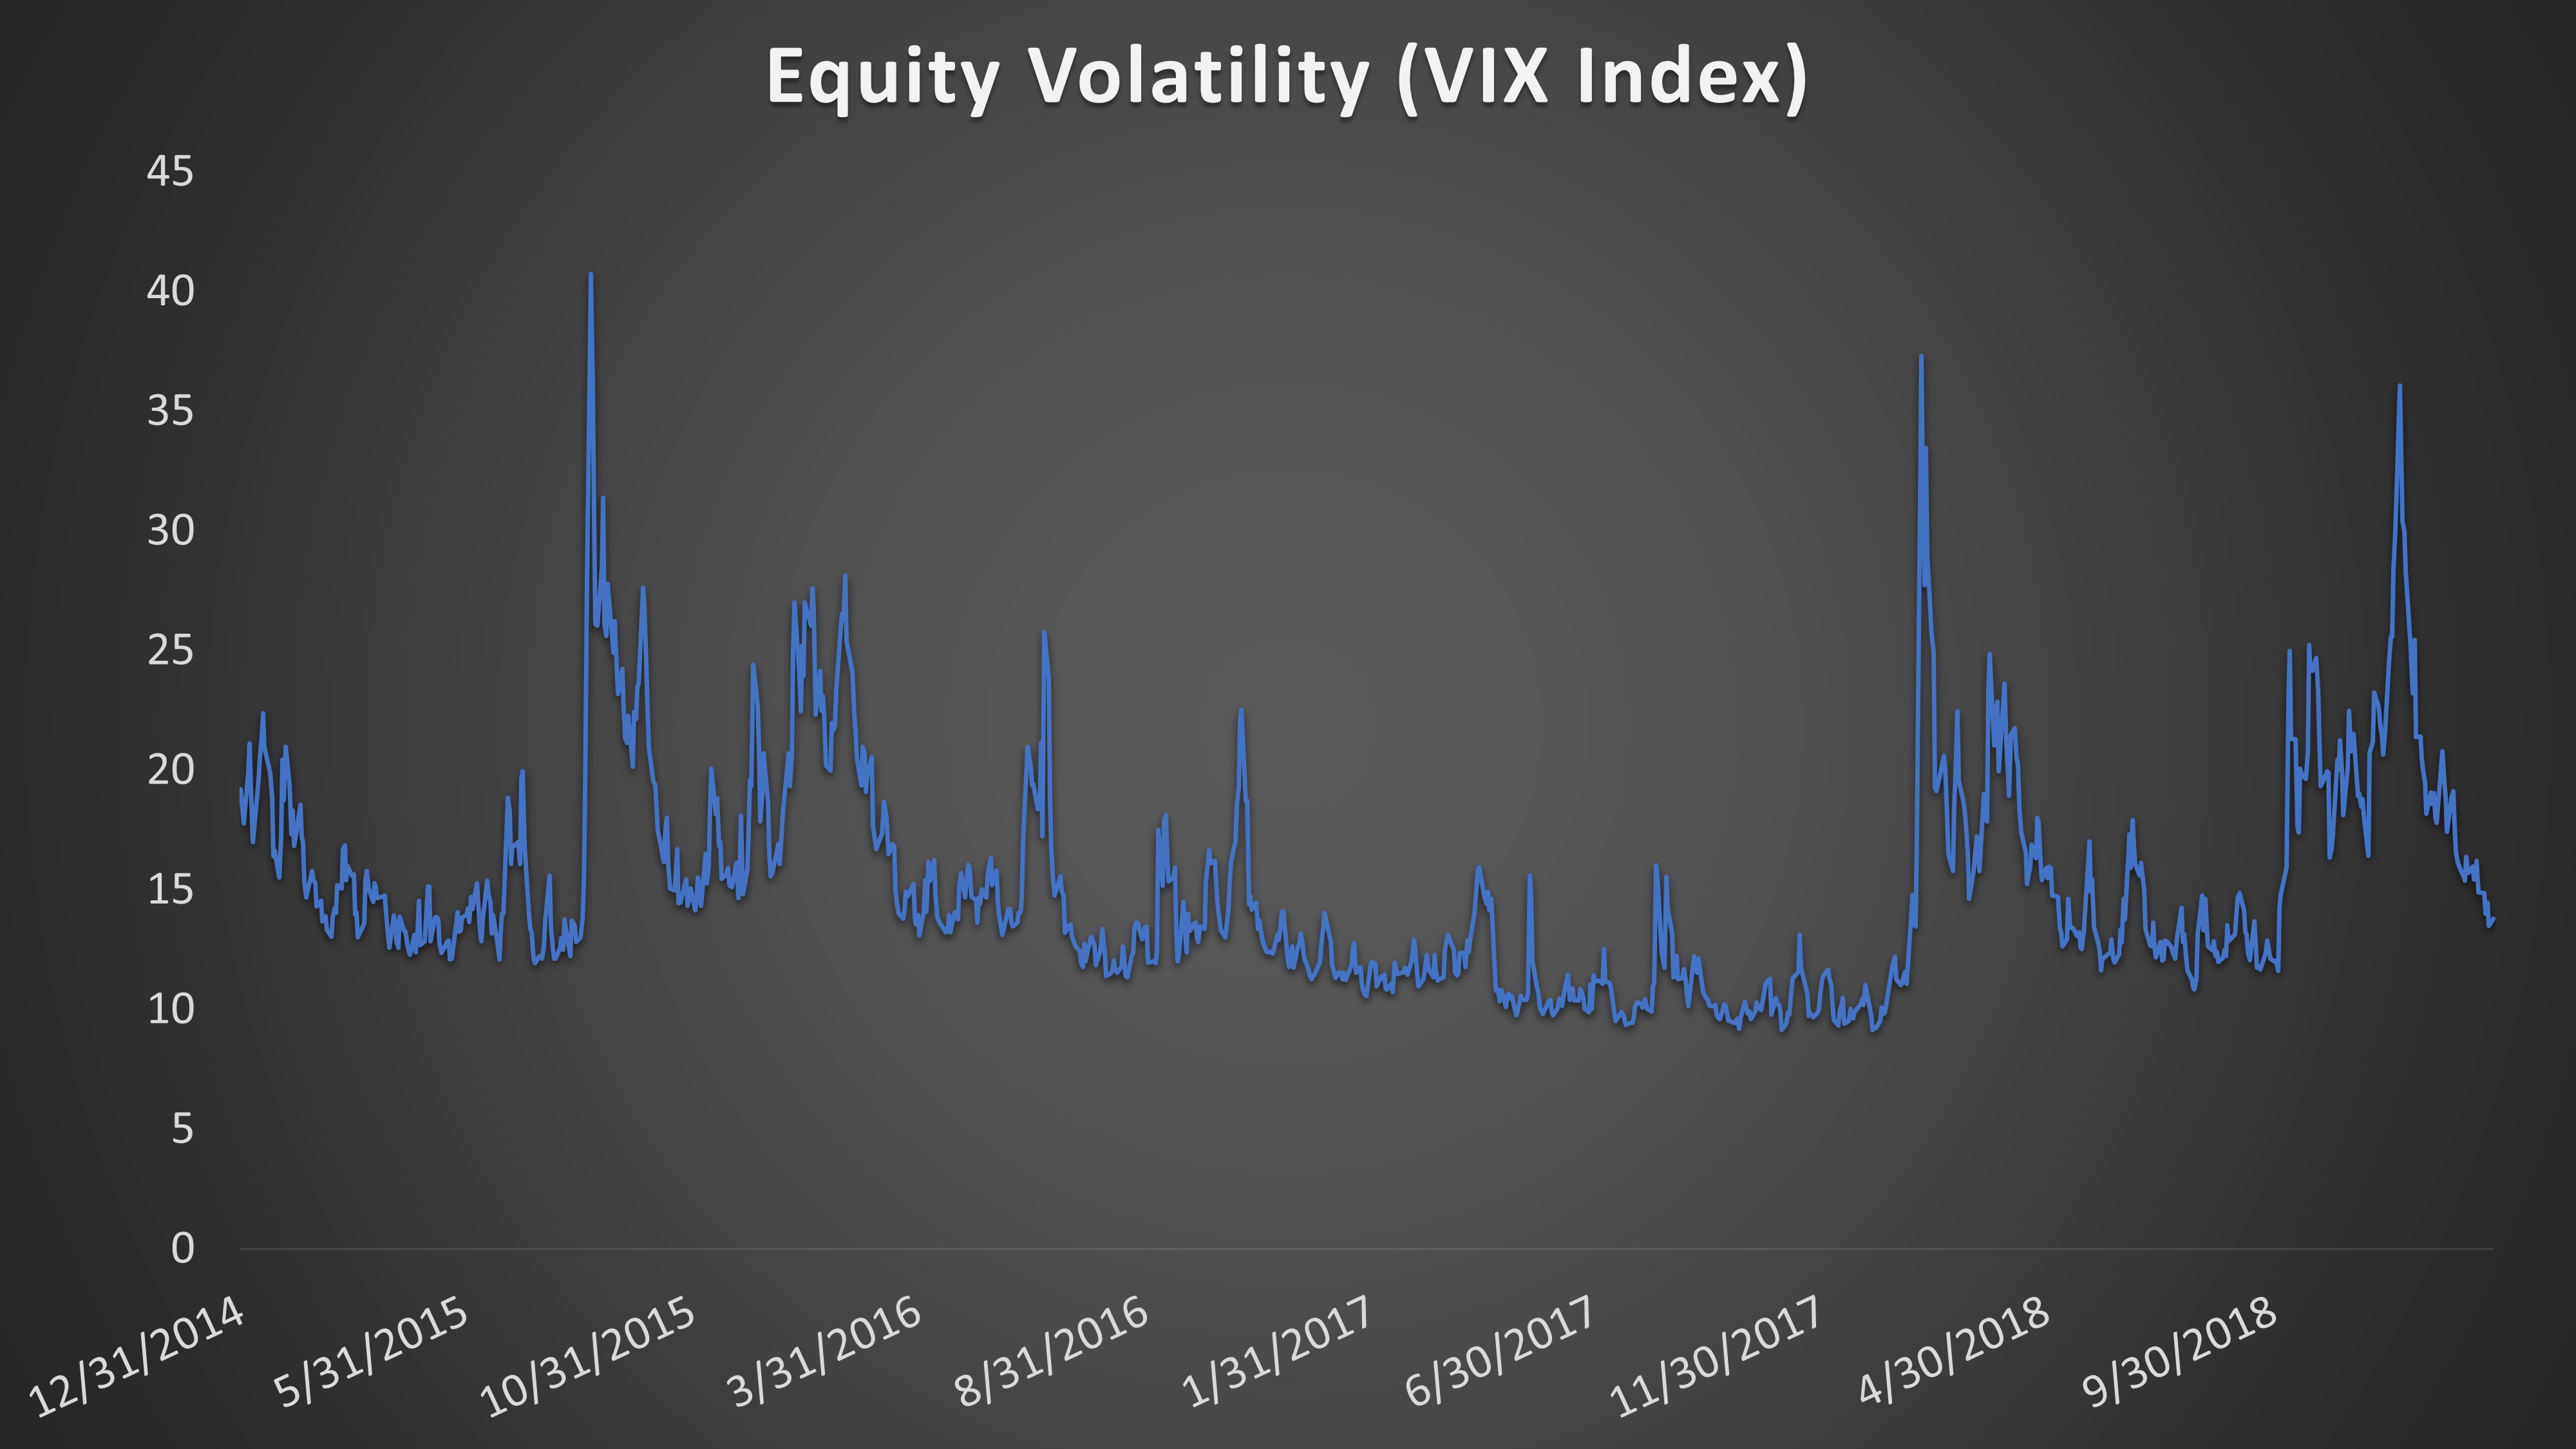
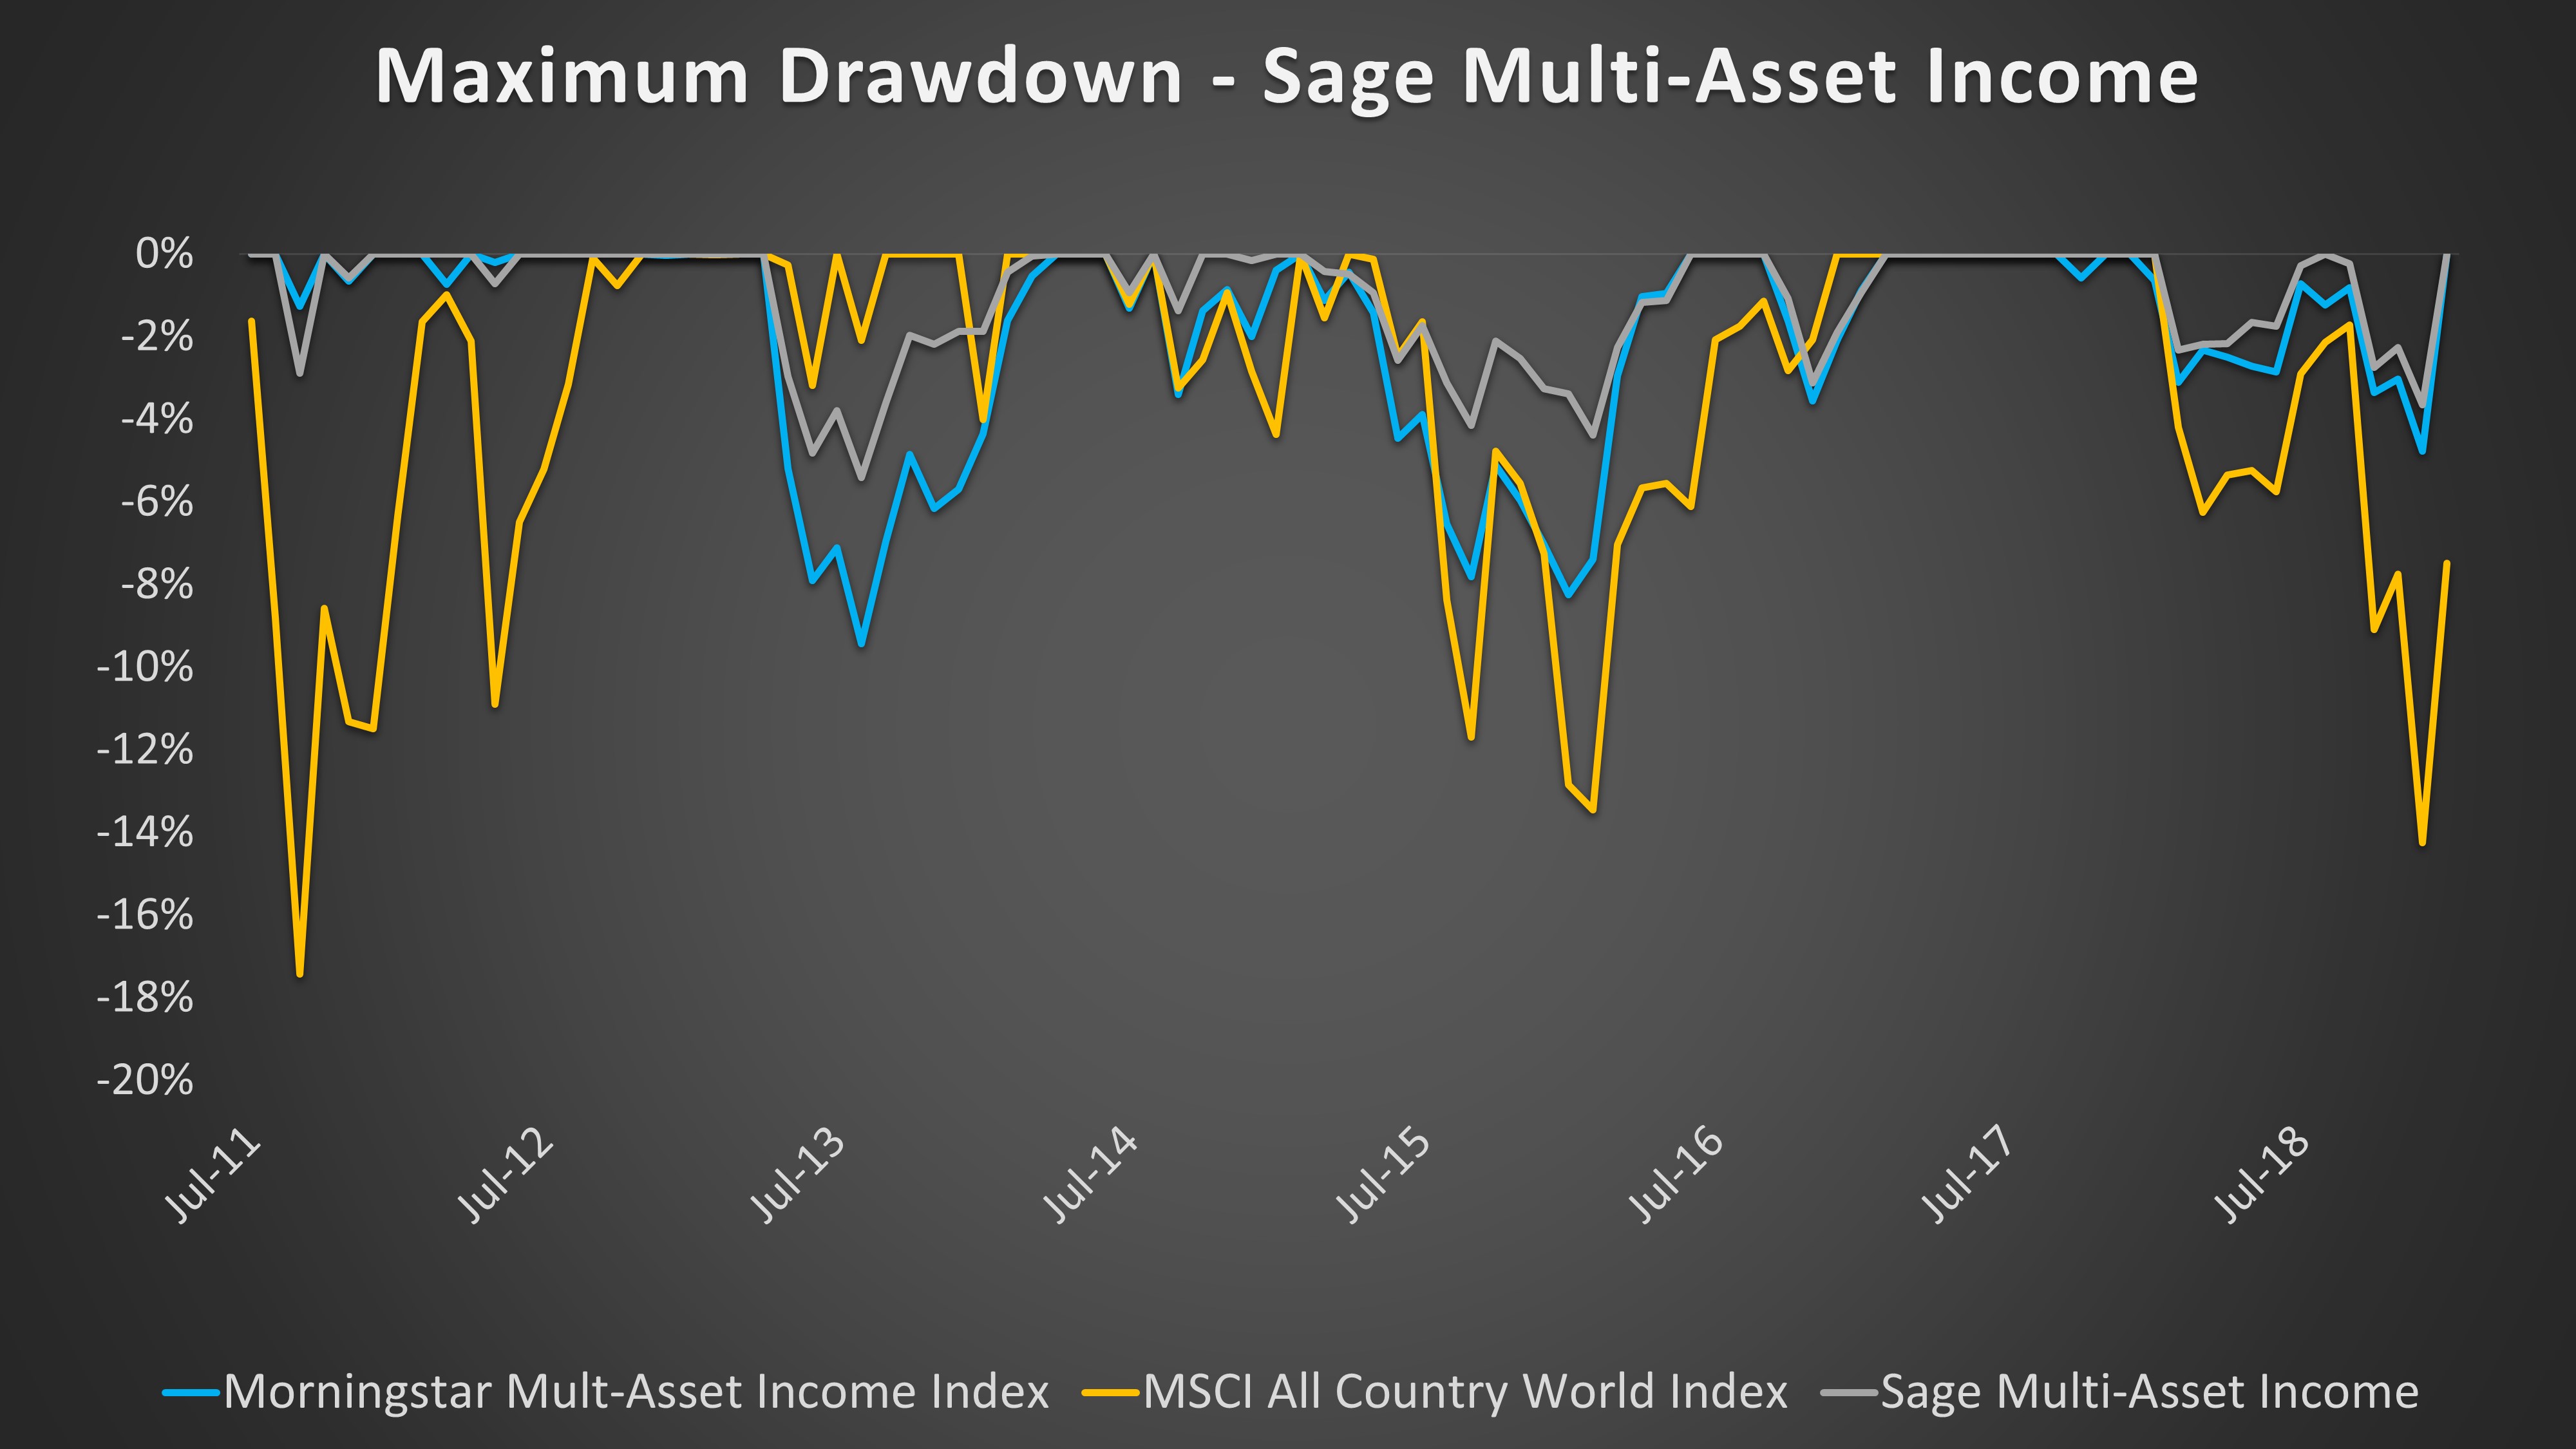
While many MAI strategies have boasted equity-like returns during the recovery, they have also come with equity-like volatility. This was evidenced in 2018, as most MAI funds experienced negative returns, similar to equities. Before 2018, the last year there was a spike in volatility was 2015; MAI funds also struggled that year. The reason is that most MAI strategies rely heavily on high-dividend equities and equity-like markets, such as preferred stocks, high-yield, and alternative fixed income (such as MLPs). This is appropriate to generate higher yields, but if it’s not balanced with an allocation to core high-quality fixed income and managed with overall risk level and volatility in mind, it will lead to a large drawdown in risk-off markets and a high correlation to equities.


We believe that for income-focused investors, large drawdowns and high correlations to equities are unacceptable. Sage’s MAI strategy is managed on a yield-to-volatility concept, where we measure the attractiveness of an income-generating market not by yield alone, but also by its ratio of yield-to-volatility. This ensures we are not gravitating too strongly toward high-income markets with rising volatility or “reaching for yield” in an environment of increasing risks.


At Sage we manage the portfolio with a “risk budget,” so our portfolio’s volatility is closer to a fixed income index than an equity index. This ensures that our portfolios are always well diversified, have a core allocation to high-quality fixed income, and act more like a fixed income portfolio in volatile markets than an equity portfolio. While this approach puts us on the more conservative side of the typical MAI strategy, we will gladly sacrifice modest levels of income and return in bull markets for a more soundly constructed income allocation. In the long run, it’s Sage’s MAI strategy is about 1) generating consistent income without the risk of giving years’ worth of that income back in one drawdown, and 2) providing clients a smooth ride along the way.


Disclosures: This is for informational purposes only and is not intended as investment advice or an offer or solicitation with respect to the purchase or sale of any security, strategy or investment product. Although the statements of fact, information, charts, analysis and data in this report have been obtained from, and are based upon, sources Sage believes to be reliable, we do not guarantee their accuracy, and the underlying information, data, figures and publicly available information has not been verified or audited for accuracy or completeness by Sage. Additionally, we do not represent that the information, data, analysis and charts are accurate or complete, and as such should not be relied upon as such. All results included in this report constitute Sage’s opinions as of the date of this report and are subject to change without notice due to various factors, such as market conditions. Investors should make their own decisions on investment strategies based on their specific investment objectives and financial circumstances. All investments contain risk and may lose value. Past performance is not a guarantee of future results.

Sage Advisory Services, Ltd. Co. is a registered investment adviser that provides investment management services for a variety of institutions and high net worth individuals. For additional information on Sage and its investment management services, please view our web site at www.sageadvisory.com, or refer to our Form ADV, which is available upon request by calling 512.327.5530.

February Equities Outlook in 5 Charts

1. The U.S. consumer remains a bright spot amid slowing economic activity abroad and a cooling U.S. corporate sector.


2. Equity indices have recovered the bulk of their losses from the fourth quarter and valuations appear fair. Given a more challenging macro picture, fixed income has become the more attractive asset class.


3. Some sectors, such as Tech and Industrials, have reaped strong year-to-date returns. Given continued volatility and slowing trends, this has created a case for more defensive sectors.


4. Political risks and slowing economic data has created a tepid view toward developed international markets versus the U.S.; however, markets have already discounted much of this risk.


5. Sentiment toward emerging markets equities turned positive in mid-2018, and investors continue to show confidence in the region due to a more dovish rate environment and expectations for further stimulus from China.


The source for all charts is Bloomberg.


Disclosures: This is for informational purposes only and is not intended as investment advice or an offer or solicitation with respect to the purchase or sale of any security, strategy or investment product. Although the statements of fact, information, charts, analysis and data in this report have been obtained from, and are based upon, sources Sage believes to be reliable, we do not guarantee their accuracy, and the underlying information, data, figures and publicly available information has not been verified or audited for accuracy or completeness by Sage. Additionally, we do not represent that the information, data, analysis and charts are accurate or complete, and as such should not be relied upon as such. All results included in this report constitute Sage’s opinions as of the date of this report and are subject to change without notice due to various factors, such as market conditions. Investors should make their own decisions on investment strategies based on their specific investment objectives and financial circumstances. All investments contain risk and may lose value. Past performance is not a guarantee of future results.

Sage Advisory Services, Ltd. Co. is a registered investment adviser that provides investment management services for a variety of institutions and high net worth individuals. For additional information on Sage and its investment management services, please view our web site at www.sageadvisory.com, or refer to our Form ADV, which is available upon request by calling 512.327.5530.


February Fixed Income Outlook in 5 Charts

1. By pausing rate hikes and slowing quantitative tightening, the Federal Reserve has supported equities and other risk assets; valuations have since moved back to fair territory after the January rally. This chart illustrates how the Fed’s policy reactions have corresponded with the direction of equity markets.


2. The fourth quarter provided an excellent opportunity to add credit exposure as markets became too aggressive in pricing in recession concerns. Supportive technical indicators and higher yields suggest credit has further room to outperform.


3. Downward pressure on rates caused by a more dovish Fed and weakening global growth is being offset by continued balance sheet runoff and moderate growth in the U.S. Rates are likely to be rangebound in the near-term.


4. A strong housing market coupled with a rangebound outlook for interest rates are supportive of an allocation to mortgage pass-throughs.


5. Bullish sentiment, yield carry, and valuation data suggest now is the time to hold an allocation to select non-core fixed income sectors, such as emerging markets.


The source for all charts is Bloomberg.

Disclosures: This is for informational purposes only and is not intended as investment advice or an offer or solicitation with respect to the purchase or sale of any security, strategy or investment product. Although the statements of fact, information, charts, analysis and data in this report have been obtained from, and are based upon, sources Sage believes to be reliable, we do not guarantee their accuracy, and the underlying information, data, figures and publicly available information has not been verified or audited for accuracy or completeness by Sage. Additionally, we do not represent that the information, data, analysis and charts are accurate or complete, and as such should not be relied upon as such. All results included in this report constitute Sage’s opinions as of the date of this report and are subject to change without notice due to various factors, such as market conditions. Investors should make their own decisions on investment strategies based on their specific investment objectives and financial circumstances. All investments contain risk and may lose value. Past performance is not a guarantee of future results.

Sage Advisory Services, Ltd. Co. is a registered investment adviser that provides investment management services for a variety of institutions and high net worth individuals. For additional information on Sage and its investment management services, please view our web site at www.sageadvisory.com, or refer to our Form ADV, which is available upon request by calling 512.327.5530.

The Four Seasons of Muni Bond Investing

Timing is everything. For a municipal bond investor, annual seasonal trends can provide great entry and exit points, if executed properly. There are four distinct seasonal periods that occur annually due to structural factors inherent in the municipal bond market. If timed correctly, municipal investors can increase their probability of successfully trading these markets and reap the reward of better returns.

The four seasonal periods that affect the municipal market on an annual basis are January Reinvestment, Tax Season, June/July Redemptions, and the Holiday Season Slowdown.

January Reinvestment

Although not the heaviest period of bond maturity and coupon payments, January 1st does experience an elevated level of cash that needs to be reinvested. In addition, the lingering effects of the Holiday Season Slowdown contribute to a limited amount of new issue supply, as well as diminished levels of secondary supply offered by broker/dealers. This strong technical environment tends to last anywhere from a few weeks to well into February, depending on the direction and magnitude of market flows. For investors who can time liquidity needs, January represents one of the most advantageous times of year to raise funds.

Tax Season – late March through April

From late March until the end of April, the municipal bond market tends to see both a reduction in demand as well as a heightened level of selling to fund tax payments. (Selling tax-exempt municipal bonds to fund personal federal and state tax liabilities remains one of life’s great mysteries.) Regardless, tax season provides an attractive entry point for investors, as limited demand and improving new issue supply tend to push valuations to more attractive levels.

June/July Redemptions

The heaviest period of maturing bonds and coupon payments is during these two months and represents anywhere from 40% to 60% of annual redemptions. Typically, municipal issuers come to market during this time, which offsets the demand pressure from reinvestment. Unfortunately, over the past several years, municipalities have been paying down debt and reducing debt issuance, which has created a net negative supply environment. As long as new issuance remains below the long-term averages, municipal bonds will remain supportive during June and July and provide investors an opportune time to rebalance portfolios (such as reducing credit risk).

Holiday Season – late November through year-end

Thanksgiving should indicate a warning sign to investors regarding optimal liquidity and ample supply. During the week of Thanksgiving, the markets may be open; however, the focus of the market is limited. The last week of November and the first two weeks of December represent the final opportunity for investors to efficiently trade before the market essentially shuts down for the year. Junior traders and reduced staff remain the norm during the last two weeks of the year. Market making and risk taking are severely restricted and a noticeable liquidity premium on bonds is apparent. Fortunately, for those investors looking to put cash to work, the ability to purchase bonds from forced market sells offers the opportunity to add exposure at discounted levels.

Sage has always believed that a well-informed investor is a successful investor. Investors looking to make strategic and tactical shifts into and out of municipal bonds can enhance returns by timing seasonal effects appropriately. By combining Sage’s value-based investment strategy with seasonal timing of cash flow, investors will be able to maximize market liquidity and optimize return potential.


Disclosures: This is for informational purposes only and is not intended as investment advice or an offer or solicitation with respect to the purchase or sale of any security, strategy or investment product. Although the statements of fact, information, charts, analysis and data in this report have been obtained from, and are based upon, sources Sage believes to be reliable, we do not guarantee their accuracy, and the underlying information, data, figures and publicly available information has not been verified or audited for accuracy or completeness by Sage. Additionally, we do not represent that the information, data, analysis and charts are accurate or complete, and as such should not be relied upon as such. All results included in this report constitute Sage’s opinions as of the date of this report and are subject to change without notice due to various factors, such as market conditions. Investors should make their own decisions on investment strategies based on their specific investment objectives and financial circumstances. All investments contain risk and may lose value. Past performance is not a guarantee of future results.

Sage Advisory Services, Ltd. Co. is a registered investment adviser that provides investment management services for a variety of institutions and high net worth individuals. For additional information on Sage and its investment management services, please view our web site at www.sageadvisory.com, or refer to our Form ADV, which is available upon request by calling 512.327.5530.


Pensions Enjoy Lump-Sum Savings in 2019

Lump sum offerings can be valuable in transferring risk away the from plan sponsor by reducing a defined benefit plan’s overall liability exposure. Lump sums can be costly, especially in today’s low interest rate environment, and can have a negative effect on a plan’s funded status. But since interest rates rose during 2018, the result in many cases is lower lump-sum present values in 2019.

As a refresher, pension-plan sponsors generally account for the possibility that they will pay out benefits to their participants over many years. However, if participants choose to receive lump sums, the plan makes a single payment per participant, rather than multiple payments over several years. The result is a reduction of liabilities that the plan carries forward.

The IRS mandates that lump-sum payouts must meet minimum present values as determined in IRC 417(e)(3), with interest rate assumptions derived from mark-to-market corporate bond yields. The plan document defines the method of calculating lump sums with respect to IRC 417(e). Most commonly, a plan will be able to value lump sums with segment rates that are fixed for the entire plan year. This means that any lump-sum payments made in any time of the plan year will use the same segment rates.

For example, if a plan has a stability period of a year, a lookback month of 2, and the lump-sum calculations are for the 2019 plan year (calendar year plan), the November 2018 417(e) rates will be used for all lump sum payouts that occur in 2019. This is important because this means that lump-sum values can vary dramatically from one year to the next based on moves in interest rates and/or mortality assumption updates.

Exhibit 1 shows the changes in the 417(e) segment rates with varying lookback months (based on a calendar year basis). Overall, the rates have increased in 2018.


 Exhibit 1. Change in 417(e) segment rates from 2018 to 2019.


Until recently, the last several years have been a series of declining rates. Exhibit 2 shows the historical November 417(e) rates over the last decade. Long term rates (Segment 2 and 3) have been generally trending downwards since November 2013. This means, generally speaking, that each subsequent year’s lump-sum present values since the 2014 plan year have been more costly than in its prior year. The rate increase from November 2017 to November 2018 is the first substantial increase we have seen since 2013.


Exhibit 2: Historical November 417(e) Segment Rates


How much have lump-sum costs declined from the 2018 to 2019 plan year? To answer, let’s assume that the stability period is a year, and the lookback month is 2. We assume a normal retirement age of 65, and adjust for the population aging 1 year from 2018.

Exhibit 3 shows the result of the change in the minimum present values from 2018 to 2019 at varying ages of a $1,000 monthly accrued benefit. The overwhelming result is that lump sums payable in 2019 are less than those paid in 2018. The leading factor is the change in rates that occurred in 2018. Mortality rates were also higher in the 2019 tables than 2018, which also contributed to the decline in the present values, but they account for less than 1% of the change.


Exhibit 3. Lump sum changes from 2018 to 2019


Conclusion

In summary, lump sums in 2019 are much less costly than in 2018. Plan sponsors might even find that more participants are eligible for the $5,000 involuntary cash-outs due to this reduction. With the 2019 PBGC per-participant premium up 40% from 2015, reducing liability exposure can help long-term savings on the plan’s ongoing expenses. Overall, 2019 may be an opportune time to take advantage of lower lump-sum values.

There are also implications for managers of liability-driven investment (LDI) strategies. Plans often discover that lump-sum payouts affect the duration of their liabilities, which should prompt asset managers to adjust their portfolios accordingly. At Sage, we work as fiduciaries with our pension-plan clients to ensure that we operate with the most current actuarial data so that the LDI portfolios we manage maintain tight durations relative to liability benchmarks. That ensures that the asset allocation remains effective, even with changes to projected liabilities resulting from lump-sum payouts or any other events.


Disclosures: This is for informational purposes only and is not intended as investment advice or an offer or solicitation with respect to the purchase or sale of any security, strategy or investment product. Although the statements of fact, information, charts, analysis and data in this report have been obtained from, and are based upon, sources Sage believes to be reliable, we do not guarantee their accuracy, and the underlying information, data, figures and publicly available information has not been verified or audited for accuracy or completeness by Sage. Additionally, we do not represent that the information, data, analysis and charts are accurate or complete, and as such should not be relied upon as such. All results included in this report constitute Sage’s opinions as of the date of this report and are subject to change without notice due to various factors, such as market conditions. Investors should make their own decisions on investment strategies based on their specific investment objectives and financial circumstances. All investments contain risk and may lose value. Past performance is not a guarantee of future results.

Sage Advisory Services, Ltd. Co. is a registered investment adviser that provides investment management services for a variety of institutions and high net worth individuals. For additional information on Sage and its investment management services, please view our web site at www.sageadvisory.com, or refer to our Form ADV, which is available upon request by calling 512.327.5530.

Valuations Become Attractive for Longer-Maturity Municipal Bonds

With investor demand focused on the front end of the yield curve, longer maturities have been neglected, leading to a divergence from Treasury yield movements. We believe valuations for long-dated municipal bonds offer the high-taxed individual an attractive entry point here.

The 30-Year Municipal to Treasury ratio, M/T for short, is a common valuation indicator that can easily spot undervalued and overvalued market conditions. As of early February, the 30-Year M/T ratio was greater than 100%, which has historically been a great time to enter the market.


The benefit to taxable investors is that current 30-year municipal yields are offered at the same yield level as equivalent Treasuries. For an investor with a 35% effective tax rate, the after-tax benefit for owning municipal bonds equates to approximately 1.00% of additional yield. If investors can withstand a modest level of price volatility, extending the maturity profile of a portfolio’s bond allocation will pay dividends over time.


Disclosures: This is for informational purposes only and is not intended as investment advice or an offer or solicitation with respect to the purchase or sale of any security, strategy or investment product. Although the statements of fact, information, charts, analysis and data in this report have been obtained from, and are based upon, sources Sage believes to be reliable, we do not guarantee their accuracy, and the underlying information, data, figures and publicly available information has not been verified or audited for accuracy or completeness by Sage. Additionally, we do not represent that the information, data, analysis and charts are accurate or complete, and as such should not be relied upon as such. All results included in this report constitute Sage’s opinions as of the date of this report and are subject to change without notice due to various factors, such as market conditions. Investors should make their own decisions on investment strategies based on their specific investment objectives and financial circumstances. All investments contain risk and may lose value. Past performance is not a guarantee of future results.

Sage Advisory Services, Ltd. Co. is a registered investment adviser that provides investment management services for a variety of institutions and high net worth individuals. For additional information on Sage and its investment management services, please view our web site at www.sageadvisory.com, or refer to our Form ADV, which is available upon request by calling 512.327.5530.

Notes from the Desk: Central Banks Are No Longer a Major Pain Point

With the interest rate markets pricing in no hikes for 2019, there was room for the FOMC to disappoint at its January meeting; however, they ended up surpassing the most dovish of expectations. As a result, risk assets rallied sharply in January as global central banks followed in the Fed’s footsteps in easing financial conditions.

In his statements, Chairman Powell signaled that the case for additional rate hikes had weakened and declined to rule out that the next move in rates would be lower. Most importantly, the Fed said that it was prepared to adjust its balance sheet normalization to economic and financial developments. Basically, if raising rates or lowering the size of the Fed’s balance sheet turns out to negatively affect markets, Powell and the FOMC would adjust policy as necessary.

Thus resumes the cycle of central bank policy acting in response to financial markets. The chart below shows the 12-month forward federal funds rate compared to the S&P 500. Expectations of Fed policy have traded in lockstep with the equity markets.


Given our focus on balance sheet policy as a source of risk asset fragility, this action removes a major point of uncertainty for financial markets over the next few months. We’re still wary of a material slowing in the global economy, but as of this week – it doesn’t look like central banks will be part of the problem.


Disclosures: This is for informational purposes only and is not intended as investment advice or an offer or solicitation with respect to the purchase or sale of any security, strategy or investment product. Although the statements of fact, information, charts, analysis and data in this report have been obtained from, and are based upon, sources Sage believes to be reliable, we do not guarantee their accuracy, and the underlying information, data, figures and publicly available information has not been verified or audited for accuracy or completeness by Sage. Additionally, we do not represent that the information, data, analysis and charts are accurate or complete, and as such should not be relied upon as such. All results included in this report constitute Sage’s opinions as of the date of this report and are subject to change without notice due to various factors, such as market conditions. Investors should make their own decisions on investment strategies based on their specific investment objectives and financial circumstances. All investments contain risk and may lose value. Past performance is not a guarantee of future results.

Sage Advisory Services, Ltd. Co. is a registered investment adviser that provides investment management services for a variety of institutions and high net worth individuals. For additional information on Sage and its investment management services, please view our web site at www.sageadvisory.com, or refer to our Form ADV, which is available upon request by calling 512.327.5530.

Municipal Sector Insight: Higher Education

Larger institutions to benefit from years of tuition inflation.


The Higher Education sector represents one of the safer areas of the municipal market due to a national priority placed on advanced education, a large pool of applicants across multiple academic disciplines, and modest-to-significant endowment funds to provide credit support, to name a few. Despite the inherent safety of the sector, almost two decades of above-inflation tuition increases have finally disrupted the supply and demand dynamic. Since 2000, college tuition inflation has outpaced Consumer Price Inflation (CPI) by almost 120%; therefore, student demand has become more discerning as students now more carefully consider the risk/reward of their continued education. With this backdrop, bondholders will be required to perform more intensive credit analysis on smaller colleges and universities.


The Higher Education sector consists mostly of public and private colleges and universities that issue municipal bonds. In the current environment, mid-to-large institutions with national recognition, particularly state universities, will likely benefit from tuition increases as lower relative tuition combined with higher job placement and larger starting salaries becomes a determining factor for graduates. Smaller boutique colleges, with limited notoriety and academic prominence, are seeing lower enrollment levels, as well as a decrease in applicants. One recent casualty was Vermont’s Green Mountain College, a small liberal arts institute that finally closed its doors after 183 years. Sage anticipates that similarly positioned colleges will follow suit over the next three-to-five years.

Sage will continue to hold a diversified allocation to Higher Education credits that maintain a strong credit profile, have stable-to-improving enrollment levels, and have a strong national or regional presence. As a result of our stable credit outlook, relative valuations will be the determining factor regarding portfolio positioning for Higher Education credits.


Disclosures: This is for informational purposes only and is not intended as investment advice or an offer or solicitation with respect to the purchase or sale of any security, strategy or investment product. Although the statements of fact, information, charts, analysis and data in this report have been obtained from, and are based upon, sources Sage believes to be reliable, we do not guarantee their accuracy, and the underlying information, data, figures and publicly available information has not been verified or audited for accuracy or completeness by Sage. Additionally, we do not represent that the information, data, analysis and charts are accurate or complete, and as such should not be relied upon as such. All results included in this report constitute Sage’s opinions as of the date of this report and are subject to change without notice due to various factors, such as market conditions. Investors should make their own decisions on investment strategies based on their specific investment objectives and financial circumstances. All investments contain risk and may lose value. Past performance is not a guarantee of future results.

Sage Advisory Services, Ltd. Co. is a registered investment adviser that provides investment management services for a variety of institutions and high net worth individuals. For additional information on Sage and its investment management services, please view our web site at www.sageadvisory.com, or refer to our Form ADV, which is available upon request by calling 512.327.5530.